Flowserve ValveAnalysis User Manual
Page 13
Advertising
13
ValveAnalysis Diagnostic Software Module FCD VLENIM0113-01 – 1/06
flowserve.com
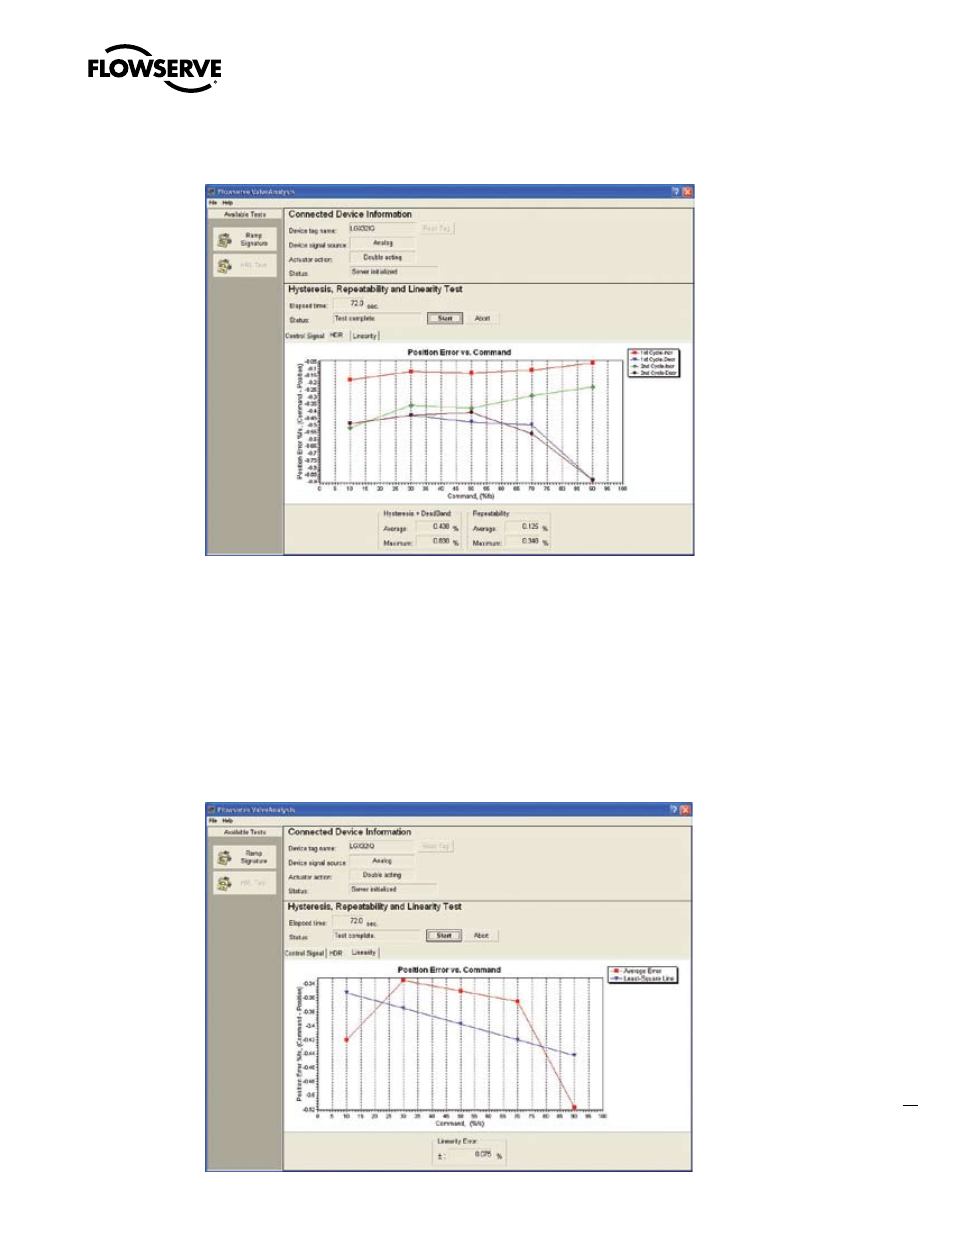
HDR
This measurement plots and calculates the hysteresis, deadband, and repeatability. The graph shows the
Position Error vs. Command. The Y-axis is labeled “Position Error %” which is equal to the Command
minus Position in percent. The X-axis is labeled Command as a percent of full stroke. Flowserve
ValveAnalysis then calculates the average and maximum combined hysteresis plus deadband and
repeatability.
Linearity
The third tab shows a graph of the valve’s linearity using two methods: average error and least-square
line. Flowserve ValveAnalysis also calculates the Linearity Error as a +/- percent. The Linearity Error is
shown directly below the graph.
Advertising
This manual is related to the following products: