La Crosse Technology WS-9630 User Manual
Page 4
18
t 78.8qqF (26qqC) 66.2 to 78.6qqF
(19 to 25.9
qC)
50 to 66
qqF
(10 to 18.9
qC)
32 to 49.8
qqF
(0 to 9.9
qC)
< 32
qqF (0qqC)
Sunny + Cloudy
19
For every sudden or significant change in the air pressure, the weather icons will update accordingly to
represent the change in weather. If the icons do not change, then it means either the air pressure has not
changed or the change has been too slow for the Weather Projection Station to register. However, if the
t 78.8qqF (26qqC) 66.2 to 78.6qqF
(19 to 25.9
qC
)
50 to 66
qqF
(10 to 18.9
qC)
32 to 49.8
qqF
(0 to 9.9
qC)
< 32
qqF (0qqC)
Cloudy + Rainy
20
icon displayed is a sun or raining cloud, there will be no change of icon if the weather gets any better
(with sunny icon) or worse (with rainy icon) since the icons are already at their extremes.
The icons displayed forecasts the weather in terms of getting better or worse and not necessarily sunny
or rainy as each icon indicates. For example, if the current weather is cloudy and the rainy icon is
displayed, it does not mean that the product is faulty because it is not raining. It simply means that the air
pressure has dropped and the weather is expected to get worse but not necessarily rainy.
Note:
After setting up, readings for weather forecasts should be disregarded for the next 12-24 hours. This will
allow sufficient time for the Weather station to collect air pressure data at a constant altitude and
therefore result in a more accurate forecast.
Common to weather forecasting, absolute accuracy cannot be guaranteed. The weather forecasting
feature is estimated to have an accuracy level of about 75% due to the varying areas the Weather station
has been designed for use in. In areas that experience sudden changes in weather (for example from
sunny to rain), the Weather station will be more accurate compared to use in areas where the weather is
stagnant most of the time (for example mostly sunny).
21
If the Weather station is moved to another location significantly higher or lower than its initial standing
point (for example from the ground floor to the upper floors of a house), remove the batteries and re-
insert them after about 30 seconds. By doing this, the Weather station will not mistake the new location
as being a possible change in air-pressure when really it is due to the slight change of altitude. Again,
disregard weather forecasts for the next 12 to 24 hours as this will allow time for operation at a constant
altitude.
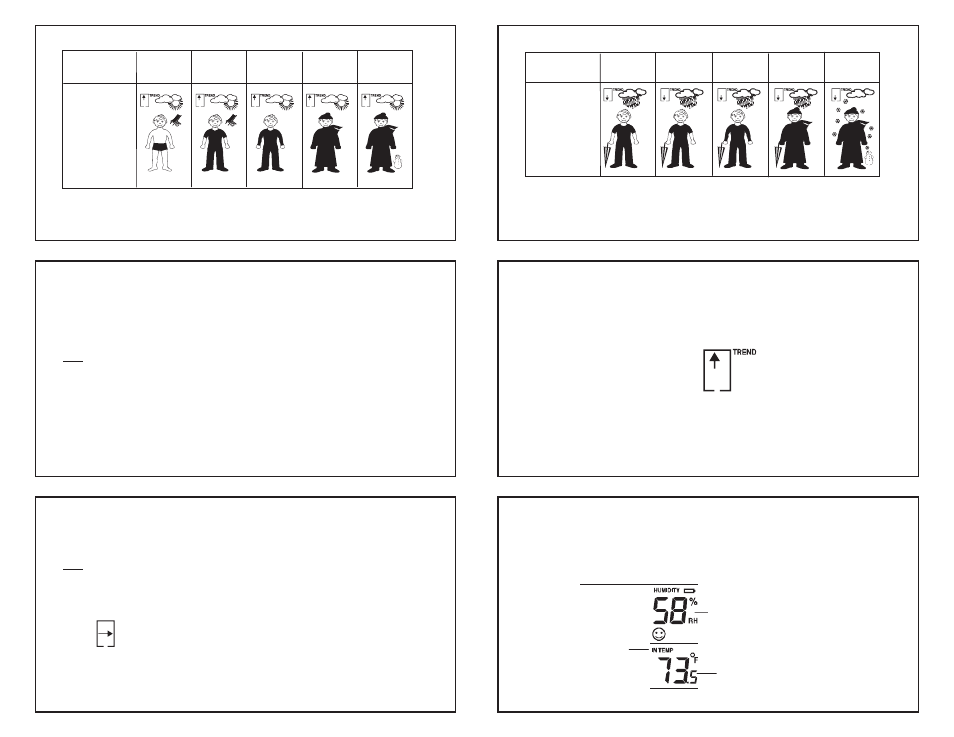
THE WEATHER TENDENCY INDICATOR
Working together with the weather icons are the weather tendency indicators (the upward and downward
arrow located near the Weather man). When the indicator points upwards, it means that the air-pressure
is increasing and the weather is expected to improve, but when indicator points downwards, the air-
pressure is dropping and the weather is expected to become worse.
22
Therefore, user may see how the weather has changed and is expected to change. For example, if the
indicator is pointing downwards together with cloudy icons, it means that the last noticeable change in the
weather was when it was sunny (the sunny icon only). Therefore, the next change in the weather will be
the cloudy icons since the indicator is pointing downwards.
Note:
x
Once the weather tendency indicator has registered a change in air pressure, it will remain
permanently visualized on the LCD.
x
When the tendency indicator is pointing to the right, it means that no pressure change has been
detected by the weather station from the beginning. Therefore, the coming weather condition is
expected to be more or less the same as the current condition.
THE COMFORT LEVEL INDICATOR:
The comfort level indicator is located at the right of the weather man icon:
The coming weather condition is expected to be more
or less the same as the current condition
TREND
23
Comfortable :
A happy face icon “
-
” indicating a temperature level between 20°C and 25.9°C
(68
qF to 78.6qF) and relative humidity reading between 45% and 65%.
Uncomfortable
: A sad face icon “
/
” indicating any value outside the comfortable range.
DISPLAY OF INDOOR TEMPERATURE AND HUMIDITY READING:
The indoor temperature and humidity are measured and displayed on the second section of the LCD.
Indoor Temperature
Indoor Relative
Humidity %
Indoor icon