Technical support – Measurement Computing USB-5100 Series User Manual
Page 7
USB-5100 Series Software: Getting Started
Plotting and Analyzing Data
7
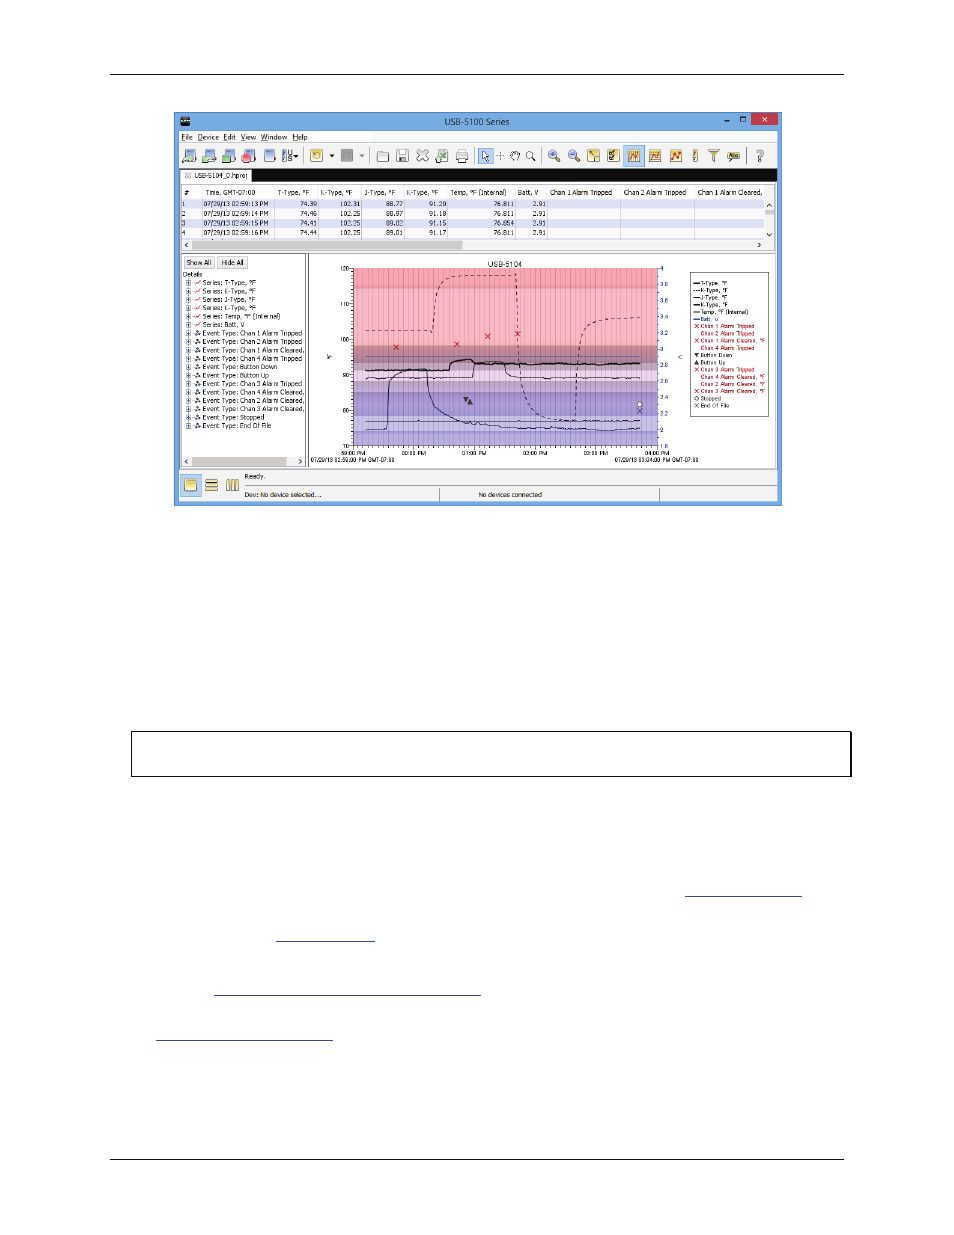
Points Table
: The table above the plot. This table lists all logged data points, including any internal events
if they were selected in the plot setup window.
Details Pane
: The pane on the left shows detailed information about the series and events currently
displayed, including device information, deployment information, and series statistics.
Graph
: The plot displays the series and (if applicable) events selected in the
Plot Setup
window. If you ran
the test described in Testing the Logger and Sensors on page 5, you should see the variances in sensor
readings and changes in internal state on the plot.
Legend
: The legend shows to the right of the plot and displays the key for each sensor, state, and event
series as well as any internal events.
Click the toolbar icons to experiment with the export, print, viewing, and customization tools. Hover the mouse
cursor over each icon to show a description.
IMPORTANT
Make sure you change any test launch settings to your preferred launch settings before deploying the logger.
Refer to the USB-5100 Series Software Help document that is installed with the software for more information
about the features in this guide and for additional details about the software.
Technical support
Additional information about USB-5100 Series Software is available on our website at
www.mccdaq.com
. You
can also contact Measurement Computing Corporation by phone, fax, or email with specific questions.
Knowledgebase:
kb.mccdaq.com
Phone: 508-946-5100 and follow the instructions for reaching Tech Support
Fax: 508-946-9500 to the attention of Tech Support
Email:
Customers outside of the U.S. should contact their local Measurement Computing distributor for support. Refer
to
www.mccdaq.com/sales.asp
to locate the distributor near you.