Xii. body composition charts, Body fat % age female male, Body water % age female male – American Weigh Scales (AWS) BioWeigh-USB User Manual
Page 7: Body muscle % age female male
Advertising
7
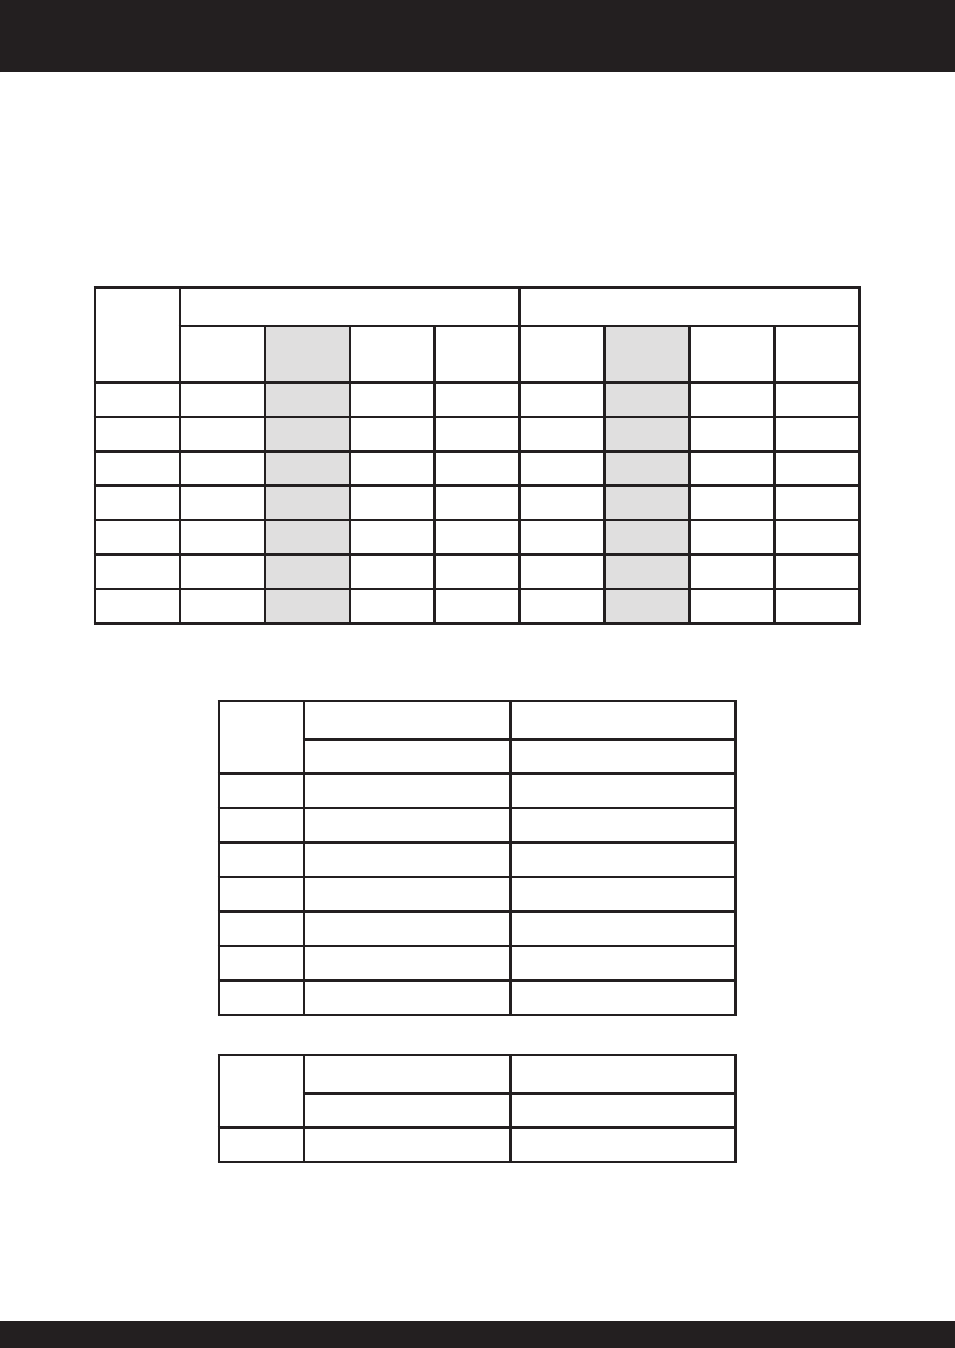
XII. Body Composition Charts
Body Fat %
Age
Female
Male
Under-
weight
Healthy
Over-
weight
Obese
Under-
weight
Healthy
Over-
weight
Obese
10-12
<12
12-22
22-30
>30
<8
8-18
18-24
>24
13-18
<15
15-25
25-33
>33
<8
8-18
18-24
>24
19-30
<20
22-31
31-38
>38
<8
8-18
18-24
>24
31-40
<24
24-33
33-40
>40
<11
11-20
20-26
>26
41-50
<24
24-33
33-40
>40
<13
13-22
22-28
>28
51-60
<26
26-35
35-42
>42
<15
15-24
24-30
>30
60+
<28
28-37
37-47
>47
<17
17-25
26-34
>34
Body Water %
Age
Female
Male
Healthy
Healthy
10-12
>60
>64
13-18
>58.5
>63.5
19-30
>56
>62.5
31-40
>53
>61
41-50
>52
>60
51-60
>51
>59
60+
>50
>58
Body Muscle %
Age
Female
Male
Healthy
Healthy
10-99
>34
>40
Advertising