Characteristic features of the light sensors, 1 lux sensor, 2 uva sensor – BINDER KBF LQC 240 User Manual
Page 78: 3 spectral range
KBF LQC (E5.3) 07/2014
page 78/114
16. Characteristic features of the light sensors
The sensors can be plugged inside the inner chamber what makes it easy to take them out for calibration
or replacement.
The intensities of illumination [LUX] and UV [W/m
2
] are measured by optical sensors inside chambers
with ICH illumination equipment (actual value display) and are temporally integrated (dose value display).
16.1 LUX sensor
Spectral sensitivity and spectral range are automatically determined with the unity “LUX”. The relative
spectral sensitivity is the V-λ distribution according to the sensitivity characteristics of the human eye.
•
Display of the actual value in kLUX
•
Display of the dose: The value “1” equals an integrated illumination of 1 MLUXh. Therefore values
from 0 to 999.9 MLUXh can be displayed on a four-place display (0-999.9). A controller value of 1.2
equals 1.2 Mio. LUXh. With e.g., 11 kLUX it will therefore take the dose display about 9 hours to in-
crease by 0.1.
16.2 UVA sensor
The UVA sensors must take into account the spectral range between 320 and 400 nm, which is defined
in ICH guideline Q1B, Option 2.
•
Display of the actual value in W/m²
•
Display of the dose: The value 1 equals an integrated illumination 1 Wh/m² (equaling 0.36 J/cm
2
).
Therefore values from 0 to 999.9 Wh/m
2
can be displayed on a four-place display (0-999.9). A control-
ler value of 200.0 equals 200.0 Wh/m
2
. With e.g., 7 W/m
2
it will therefore take the display unit about
8.6 minutes to increase by 0.1.
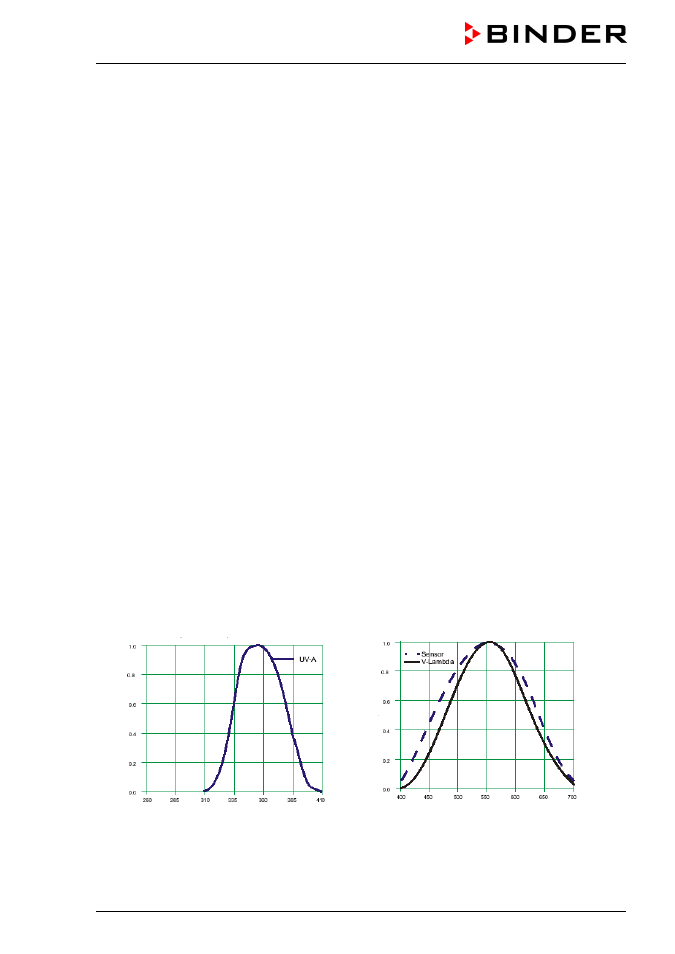
16.3 Spectral range
The spectral sensitivities of both sensors are adapted to the spectral ranges defined in the ICH guideline
Q1B, Option 2.
R
el
at
iv
e
se
ns
iti
vit
y
R
el
at
iv
e
se
ns
iti
vit
y
Wave length in nm
Wave length in nm
Figure 26: Relative spectral sensitivities