Dispersion characteristics, Technical specifications – d&b E4 User Manual
Page 7
Advertising
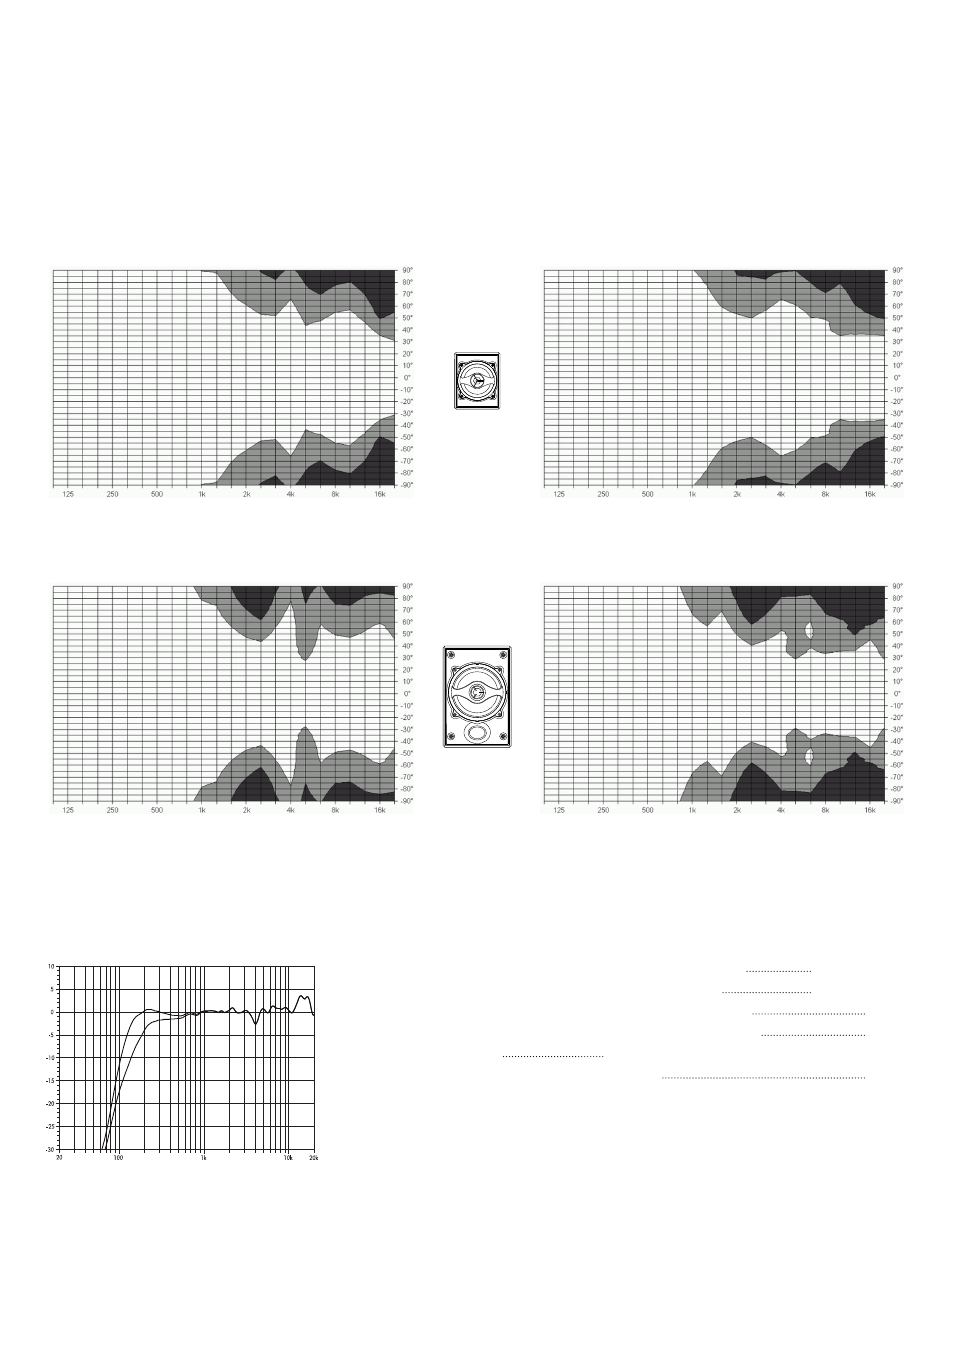
2.4. Dispersion characteristics
The following graphs show dispersion angle over frequency of a
single cabinet plotted using lines of equal sound pressure (isobars)
at –6 dB and –12 dB.
Fig. 5: Isobar diagram horizontal
E4
Fig. 6: Isobar diagram vertical
Fig. 7: Isobar diagram horizontal
E5
Fig. 8: Isobar diagram vertical
2.5. Technical specifications
E4 system data
Frequency response (–5 dB standard mode)
130 Hz - 20 kHz
Frequency response (–5 dB CUT mode)
180 Hz - 20 kHz
Max. sound pressure (1 m, free field) with D6
114 dB
Max. sound pressure (1 m, free field) with D12
115 dB
(SPLmax peak, pink noise test signal with crest factor 4)
Input level (100 dB-SPL/1 m)
–4 dBu
Fig. 9: E4 frequency response, standard and CUT modes.
d&b E4/E5 Manual (1.3 EN)
7
Advertising
This manual is related to the following products: