Dispersion characteristics, Technical specifications – d&b Vi8 User Manual
Page 8
Using the HFC function provides the correct sound balance
between close and remote audience areas, whilst all amplifiers
driving the array can be fed with the same signal.
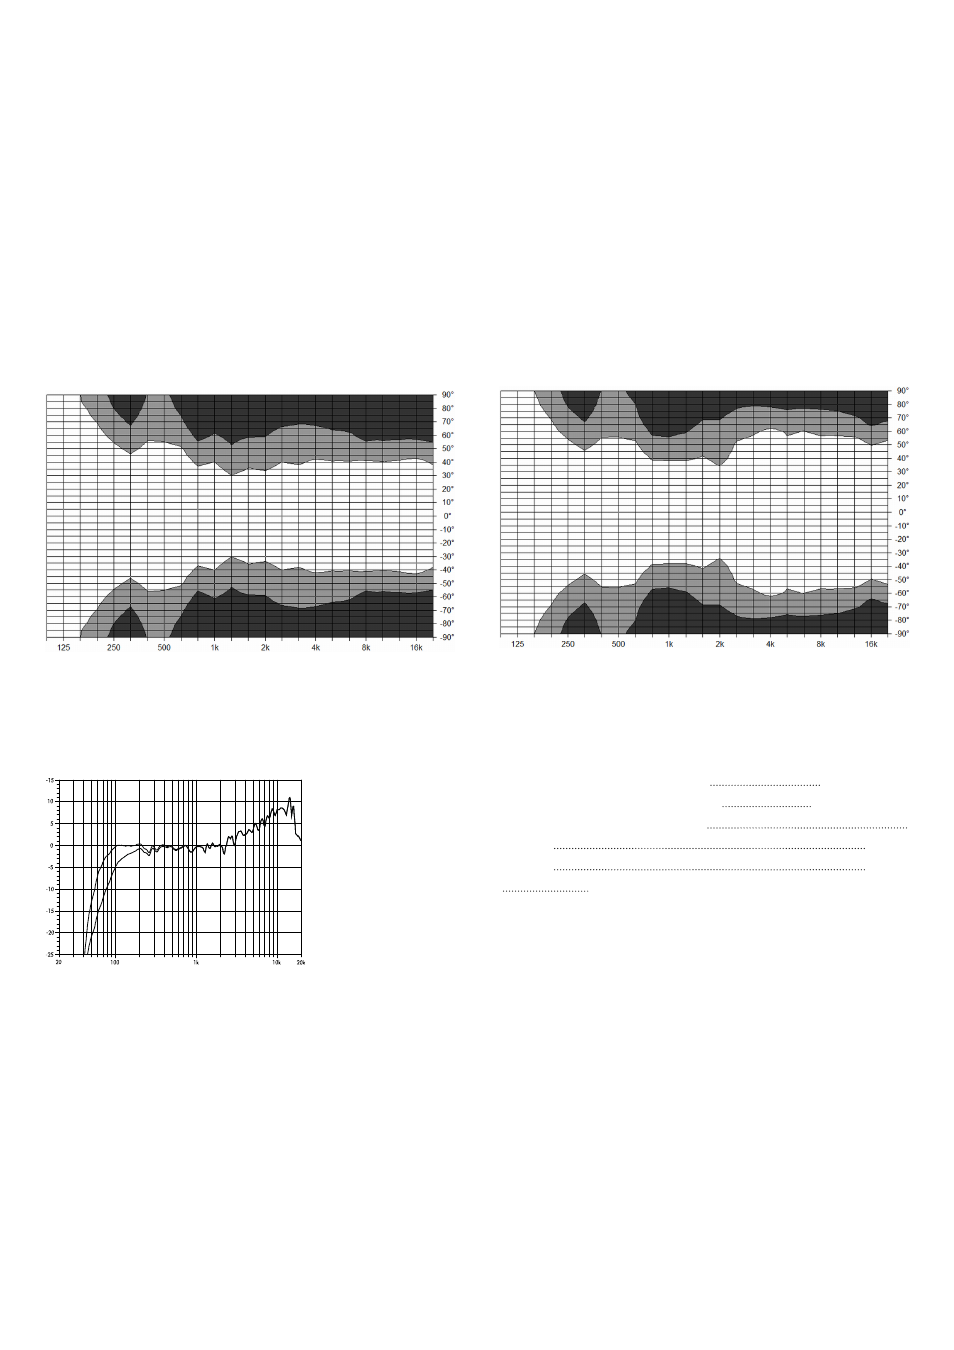
2.4. Dispersion characteristics
The graphs below show the horizontal dispersion angle over
frequency plotted using lines of equal sound pressure (isobars) at
–6 dB and –12 dB. The nominal dispersion is maintained above
600 Hz, while a useful horizontal dispersion control is achieved
down to 250 Hz.
Fig. 6: Isobar diagram Vi12 horizontal
2.5. Technical specifications
Vi8/Vi12 system data
Frequency response (–5 dB standard)
67 Hz - 18 kHz
Frequency response (–5 dB CUT mode)
100 Hz - 18 kHz
Max. sound pressure (1 m, free field)
with D80
142 dB
with D12
139 dB
(SPLmax peak, pink noise test signal with crest factor of 4)
Fig. 5: Isobar diagram Vi8 horizontal
Fig. 7: Vi8 frequency response, standard and CUT modes
d&b Vi8/Vi12 Manual (1.2 EN)
8