K-Patents PR-21-S User Manual
Page 46
40
PR-21-S instruction manual
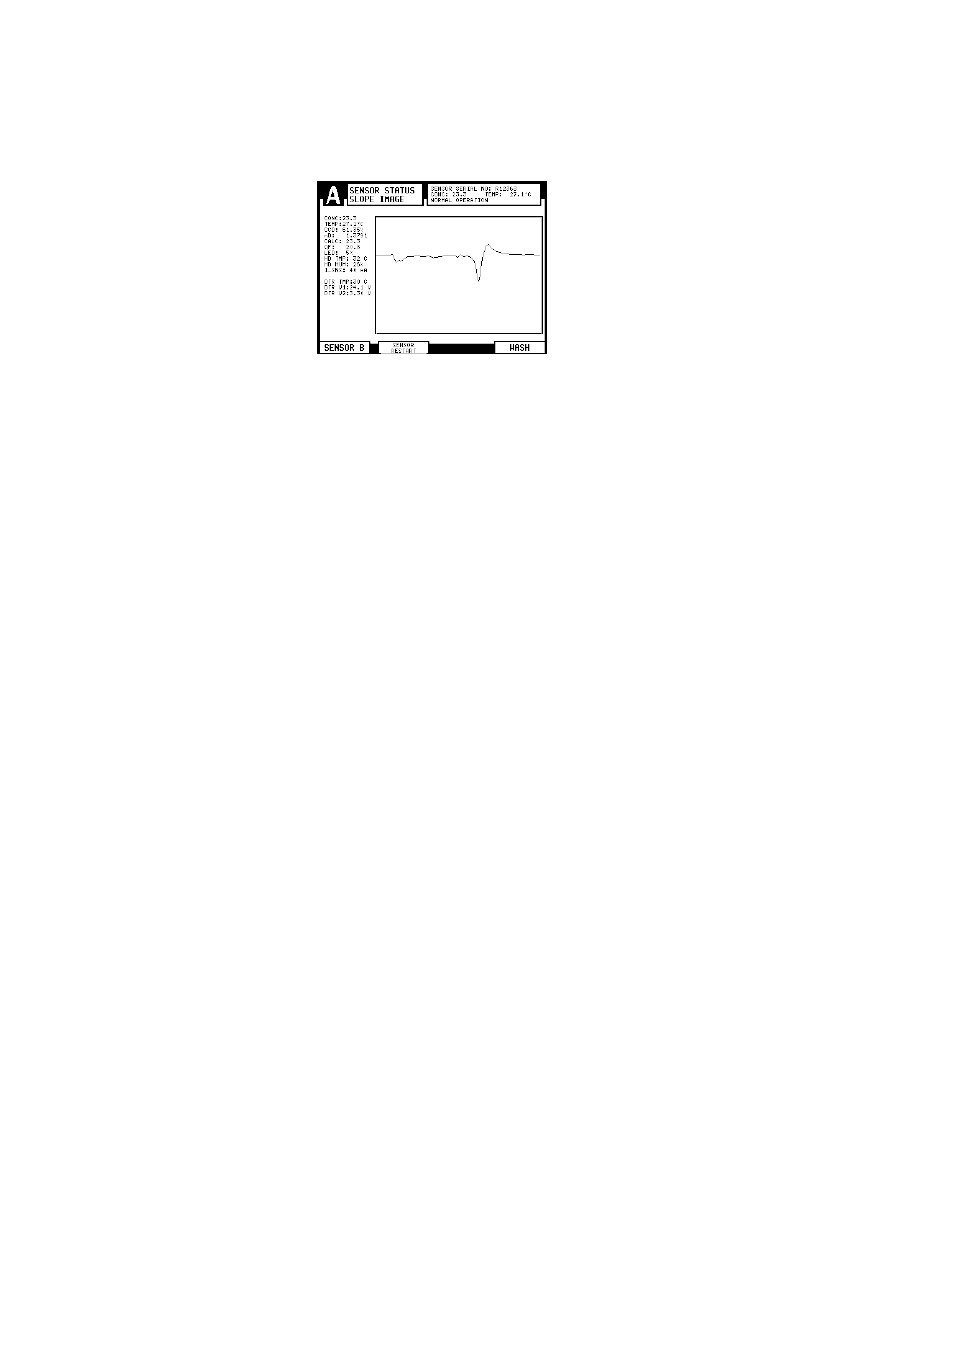
Figure 5.7
A slope graph
5.4.2 Diagnostic values
The values at the left of the graph are used for diagnostic purposes:
−
CONC
is the final concentration value including Field calibration adjustment, see
Figure 6.12.
−
TEMP
, see Section 5.4.3.
−
CCD
gives the position of the shadow edge on CCD in %.
−
nD
is the refractive index value n
D
from the sensor.
−
CALC
is the calculated concentration value without Field calibration adjustment,
Section 6.6.3
−
QF
or Quality Factor is a value in the range -1000–100. It measures the image
sharpness, a typical good value is 50. A QF value below 0 usually indicates
prism coating.
−
LED
is a measure of the amount of light from the light source in %. Should be
below 100 %.
−
HD TMP
= sensor head temperature, see Section 5.4.3.
−
HD HUM
= sensor head humidity, see Section 5.4.4.
−
I_SNS
value shows the current to sensor, the nominal value is 40 mA.
−
DTR TMP
= Indicating transmitter temperature, see Section 5.4.3.
−
DTR V1
gives the voltage from the power module, the nominal value is 24V.
−
DTR V2
gives the DC supply voltage, the nominal value is 3.3 V.
Note:
The Slope display also has a soft key
SENSOR RESTART
which can be used to
restart the current sensor (see upper left corner of the display for sensor letter)
after a sensor software update.
5.4.3 Temperature measurement
The system contains three different temperature measurements displayed to the
left of the graphs in Figure 5.6:
TEMP
is the process temperature used for automatic temperature compensation in
the Indicating transmitter (Section 6.6, “Calibrating the concentration measure-
ment”).
HD TMP
measures the temperature on the Sensor processor card PR-10100 (Fig-
ure 10.2).
DTR TMP
measures the temperature on the Motherboard of the Indicating transmit-
ter (Figure 3.6, “The Motherboard of the Indicating transmitter”).