Plant overview, Led graphic display – SMA SB 2000HF-30 User Manual
Page 2
DANgEr!
Electric shock caused by high voltage in the inverter.
Do not open the inverter!
Even when no external voltage is present, there can still be high voltages in the inverter.
• Electrical installation, repair and retrofitting may only be carried out by a trained
electrically qualified person:
• Physically or mentally challenged persons may only perform activities on the inverter
following proper instruction and under supervision.
• Children must not play with the inverter. Children must not have access to an inverter
in operation.
CAUTION!
risk of burns through contact with the enclosure during operation.
• During operation, only touch the lid and display.
Yield loss due to poor heat dissipation.
• Do not place any objects on the enclosure.
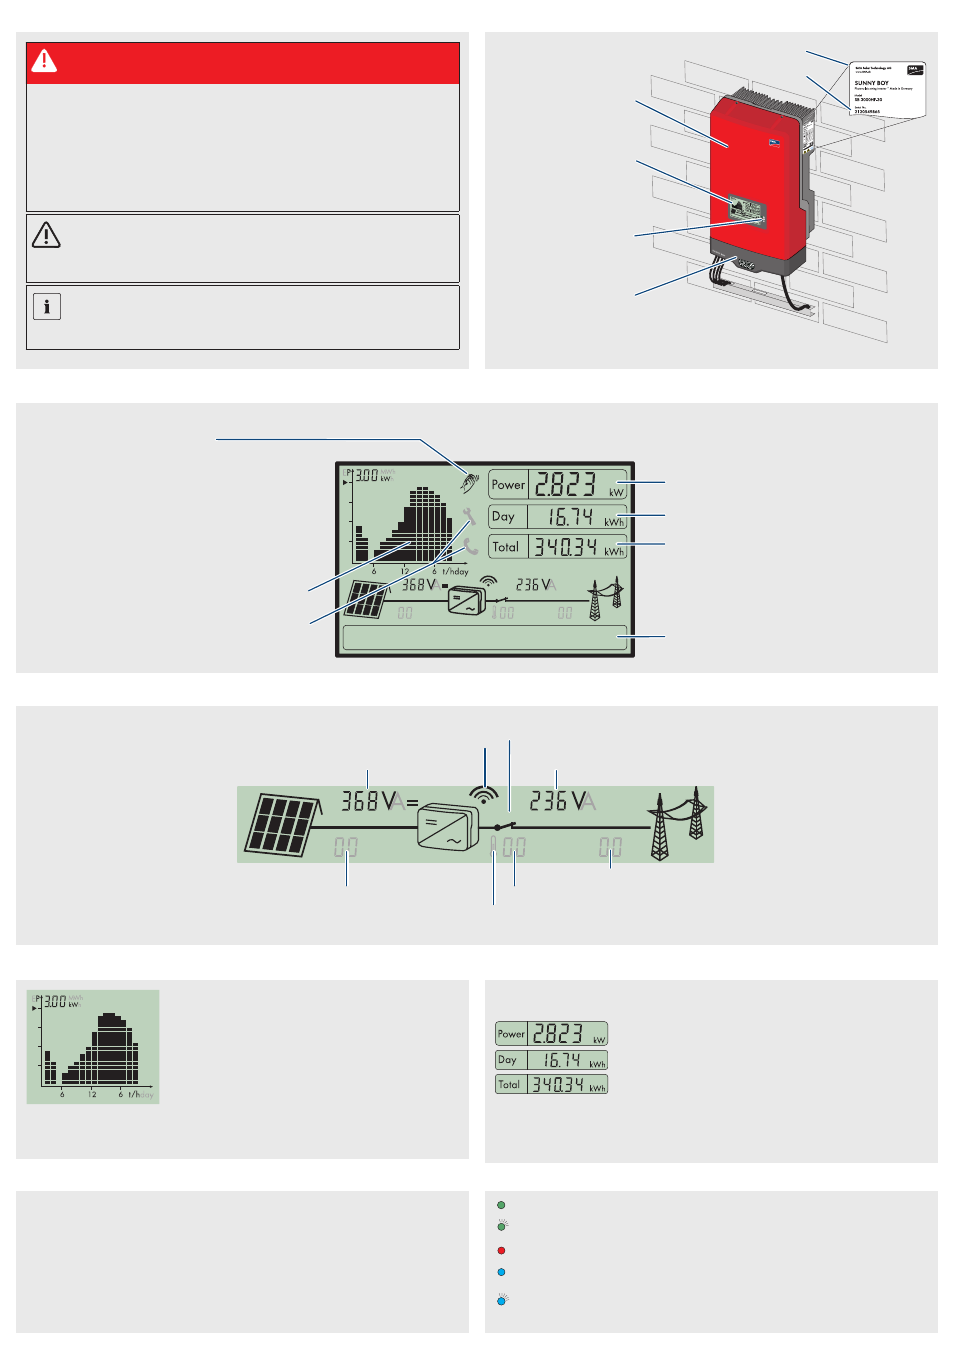
The inverter energy and/or power is shown as a diagram on the
display. The daily graph is displayed by default. The right-hand
flashing bar of the diagram represents the current hour. If the
inverter does not feed any power to the power distribution grid
over a longer period of time (e.g. in darkness or if the PV modules
are covered with snow), a gap is inserted into the chart. The
column for the current hour is updated automatically every five
seconds.
After four seconds, the bar goes off for one second and then
displays the current value.
Green LED is on:
Operation
Green LED is flashing: Waiting for sufficient irradiation
Red LED is on:
Disturbance: contact installer
Blue LED is on:
Bluetooth communication is active. The inverter can communicate with other
SMA Bluetooth devices with identical NetID.
Blue LED is flashing:
The inverter was identified via Sunny Explorer by setting the "Find device"
parameter.
The power and energy of the inverter are displayed in three fields: Power, Day and Total. The
display is updated every five seconds.
Power
The power that the inverter is currently feeding into the power
distribution grid.
Day
The energy fed into the power distribution grid on this particular day.
This equals the energy generated between the inverter's start-up in the
morning to the current time.
Total
The total energy that the inverter has fed into the power distribution
grid during its entire operating time.
Serial number
Identification of the inverter by the type label
Enclosure lid
Graphic display
LEDs
Electronic Solar Switch
PrODUCT OVErVIEw
SAFETY INSTrUCTIONS
DIAgrAM
POwEr DISPLAY
MEASUrEMENT ACCUrACY
The display values may deviate from the actual values and must not be used as a basis for invoicing.
The inverter's measured values are required for the operational control and to control the current to
be fed into the power distribution grid. The inverter does not have a calibrated meter.
PLANT OVErVIEw
Current power
Daily energy
Total energy generated since the inverter was installed
Text line for displaying an event
Graphical display of the inverter
energy/
power
The display updates the values of your PV plant every 5 seconds.
You can operate the display by tapping it:
• Tapping the enclosure lid once: The background illumination is
activated, switch between the power range of the past 16 feed-in
hours and the energy yields of the past 16 days, switch to the
next text line
• Double tapping (valid as of firmware version 2.30): the inverter
shows, in succession, the firmware version, the serial number
and designation of the inverter, the Bluetooth NetID, and the
specified country standard and display language.
Disturbance:
Contact installer
Switch open: no feed-in
Switch closed: feed-in
Grid voltage/
current
Bluetooth connection with other devices
PV voltage/
current
Event number for the power distribution grid
PV array event number
Inverter event number
Power reduction due to excessive temperature
• If the symbol is frequently displayed, contact your installer.
LED
grAPHIC DISPLAY