Linx Technologies MDEV-GPS-SG User Manual
Page 2
SG/SR Series Master Development System
Software User’s Guide
Page 2
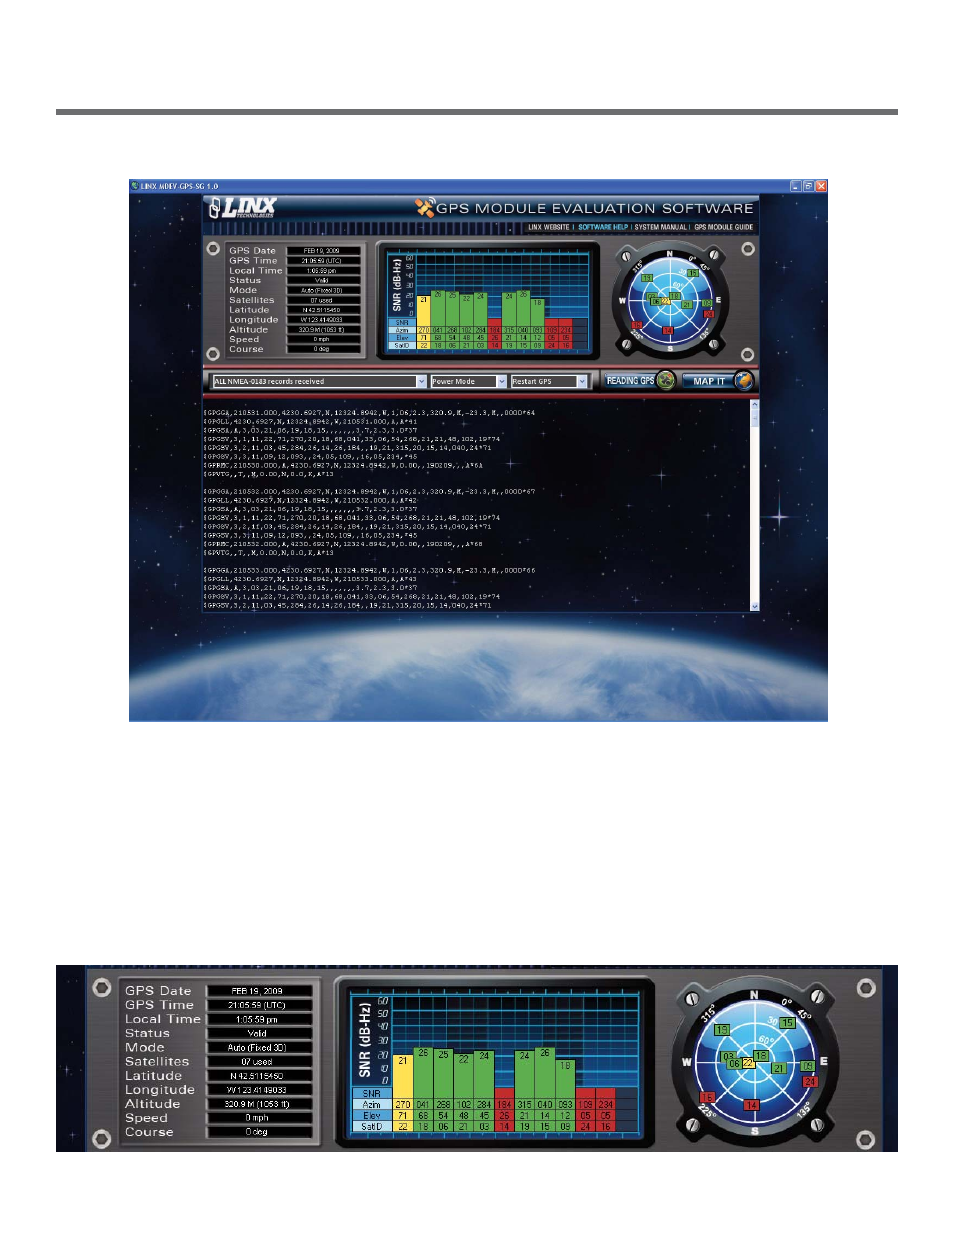
Once connection has been established, the software displays the information received from the GPS module,
as shown in the figure below.
On the top left of the screen is a list of some typical data from the module. This includes the navigation and
position information, as well as time, date, and satellite data.
In the middle is a list of information on up to 12 satellites displayed in a bar graph format. This includes the
satellite ID, its azimuth and elevation, and its signal to noise ratio. Each satellite is color coded according to how
the receiver is using it. A satellite that is being tracked and used for a position fix is green. A satellite that is
being tracked, but not used for a fix is in yellow. A satellite that is not being tracked or used is in red. The more
satellites that are used for a fix, the more accurate the fix.
On the far left is a polar plot showing the location of the satellites in view relative to the receiver’s position. The
satellite’s ID number is shown and is color coded as described above.
Figure 2: The Connected Screen
Figure 3: Connected Screen (Display Section)