Casio fx-9750G Implicit Function Graphs User Manual
Page 9
231
uuuuu
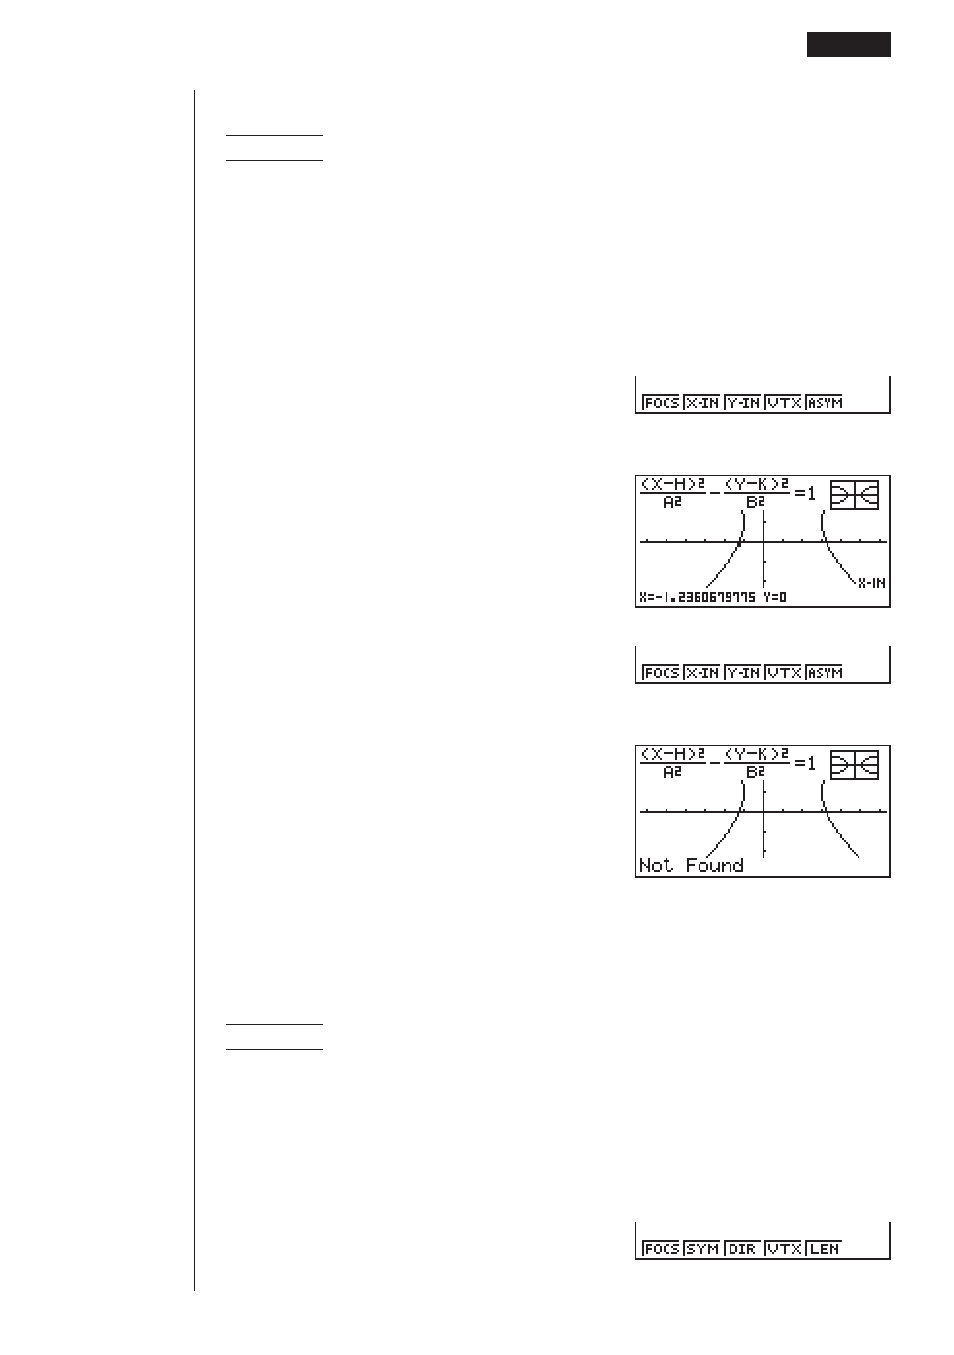
To calculate the
x
- and
y
-intercepts
Example
To determine the
x
- and
y
-intercepts for the hyperbola
(X – 1)
2
(Y – 1)
2
–––––––––– – –––––––––– = 1
2
2
2
2
Use the following View Window parameters.
Xmin
= –6.3
Ymin
= –3.1
Xmax = 6.3
Ymax = 3.1
Xscale = 1
Yscale = 1
5
(G-Solv)
2
(X-IN)
(Calculates the
x
-intercept.)
5
(G-Solv)
3
(Y-IN)
(Calculates the
y
-intercept.)
• Press
e
to calculate the second set of
x
-/
y
-intercepts. Pressing
d
returns to
the first set of intercepts.
uuuuu
To draw and analyze the axis of symmetry and directrix
Example
To draw the axis of symmetry and directrix for the parabola
X = 2(Y – 1)
2
+ 1
Use the following View Window parameters.
Xmin
= –6.3
Ymin
= –3.1
Xmax = 6.3
Ymax = 3.1
Xscale = 1
Yscale = 1
5
(G-Solv)
1
2
3 4 5 6
1 2
3
4 5 6
Implicit Function Graph Analysis
14 - 3
1
2
3 4 5 6