Viewing rt60 test data, Optional software function module rt60 – Ivie IE-45 RT60 - Reverberation Time Analysis User Manual
Page 4
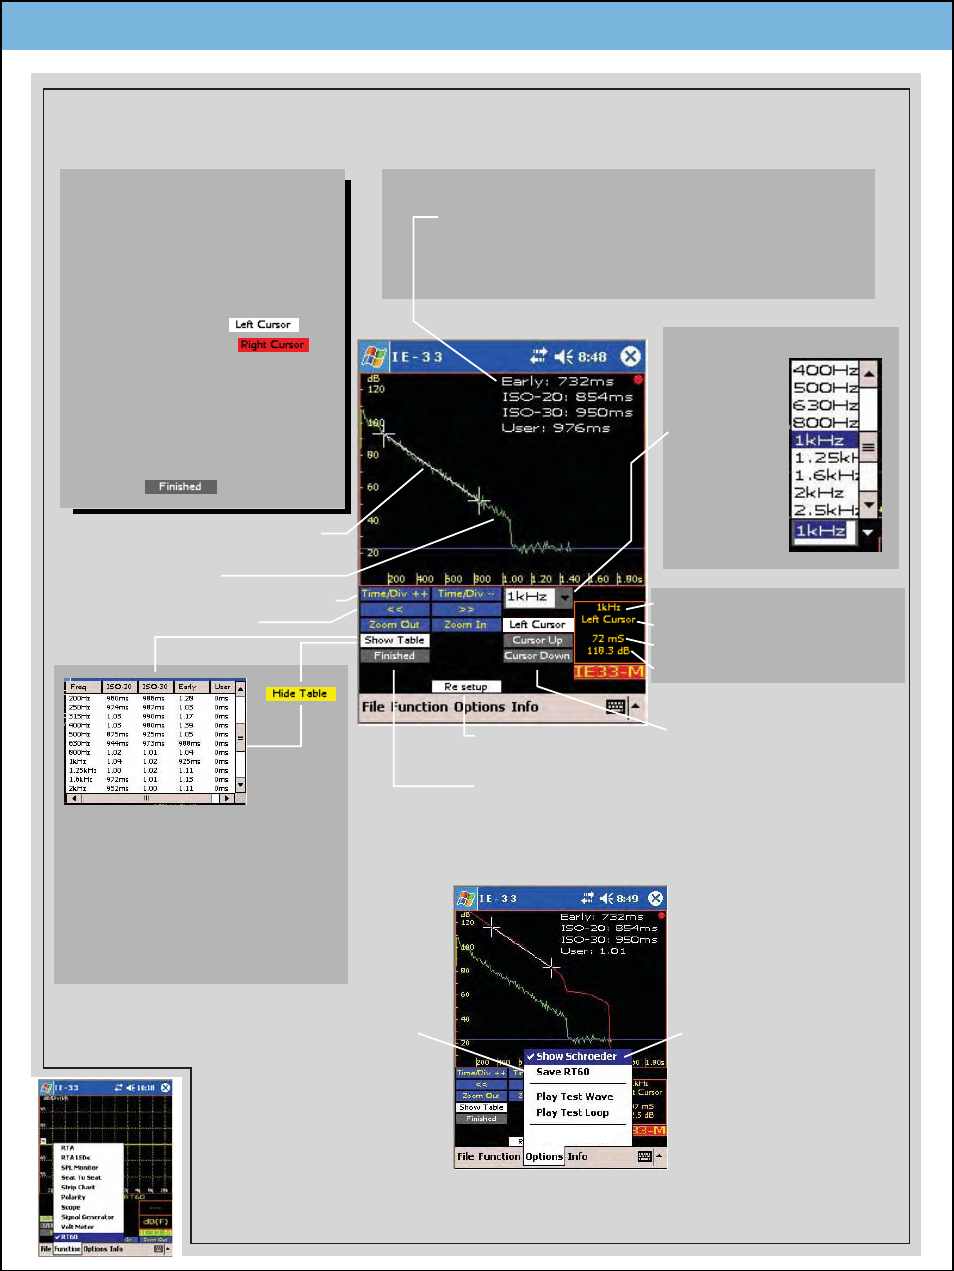
Optional Software Function Module RT60
Viewing RT60 Test Data
Expand or contract the Time scale.
Press here to initiate another test.
Displays the Schroeder
curve (in red). This
applies a smoothing
algorithm to the Decay
curve. If desired, the
Cursors may be placed
on this curve instead of
the actual decay curve.
Saves the RT60 data to a
file. Please Note: It may
take a minute or longer to
save a file. Data for each
band must be calculated
and stored along with the
240 data points per band.
Please be patient.
Thanks!
White slope determined by User
cursor placment.
Green
decay curve.
Move Cursor left or right.
Move current Cursor
up or down.
Press to Return to
the Setup screen.
Calculated RT60 Data for current 1/1 or 1/3 octave.
Early is calculated on first 5 dB of decay.
ISO-20 is calculated on -5 to -25 dB of decay.
ISO-30 is calculated on -5 to -35 dB of decay.
User is calculated on user placement of cursors.
STEP 1 - The Data is automatically
displayed upon completion of the
test.
STEP 2 - Tap on the the green
decay curve to position the Left
Cursor.
STEP 3 - Press the
button to change it to
Now tap on the green decay curve
to position the Right Cursor .
STEP 4 - Select "Options" the
"Save RT60" to save data to file.
STEP 5 - To START another TEST
press the button.
Current 1/1 or 1/3 octave.
Current Cursor (left/right).
Cursor location in milliseconds.
Cursor location in dB.
Displays data for all 10 octave or
30 1/3 octave bands.
To View
another band
tap here and
then use the
scroll button
to select the
desired band.
1/1, 1/3 Band Selection
Please Note: It will take some time
to calculate each band and fill in
the table. You will not be able to
scroll through the data until this
process is completed.