Hoefer SP-2001 Vision Life Spectrophotometer User Manual
Page 27
Version 1.0
Page 27
THE LIFE SCIENCE FOLDER
Life Science Folder
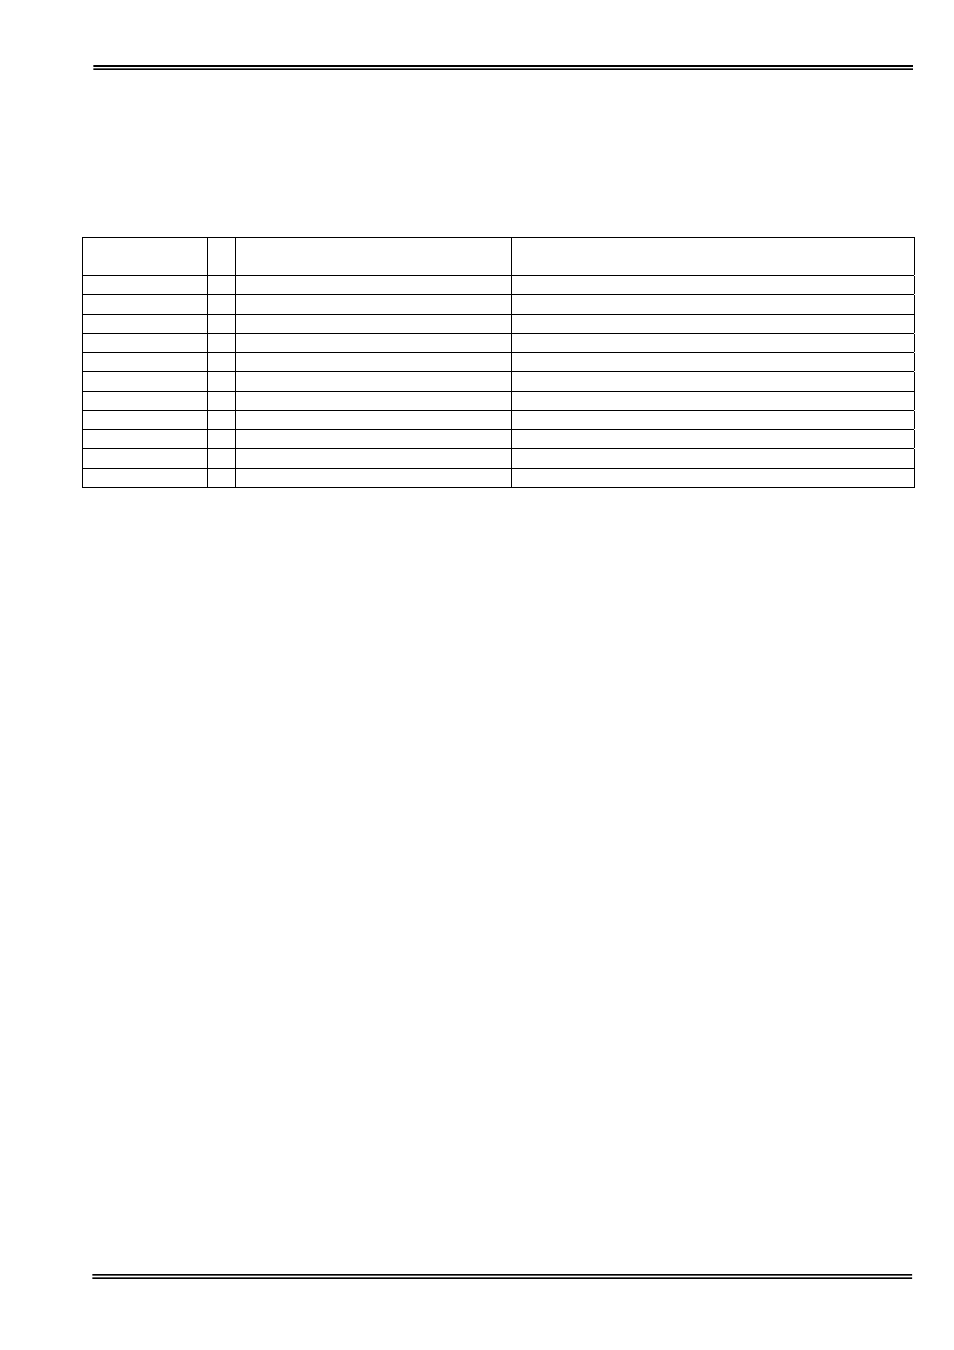
This contains three sub folders; Nucleic Acids, Protein and Cell Count. Contents of these sub folders are detailed
below:
1. Nucleic
Acids
1 DNA
Concentration and purity check for DNA samples
2 RNA
Concentration and purity check for RNA samples
3 Oligo
Concentration and purity check for oligo samples
2. Protein
1 UV protein (Christian Warburg)
Protein determination at 280nm
2 BCA
Protein determination at 562nm
3 Bradford
Protein determination at 595nm
4 Lowry
Protein determination at 750nm
5 Biuret
Protein determination at 546nm
3. Cell Count
1 OD600
Cell culture OD600 with correction factor
DNA, RNA and oligonucleotide characterization
Nucleic Acid Quantification (NAQ)
• Nucleic acids can be quantified at 260 nm because it is well established that a solution of DNA in a 10 mm
pathlength cell with an optical density of 1.0 has a concentration of 50, or 40 μg/ml in the case of RNA.
Oligonucleotides have a corresponding factor of 33 μg/ml, although this does vary with base composition; this
can be calculated if the base sequence is known.
Concentration = Abs260 * Factor
• The instrument uses factors 50, 40 and 33 as defaults for DNA, RNA and oligonucleotides, respectively, and
can compensate for dilution and use of cells which do not have 10 mm pathlength by entering dilution factor
and cell pathlength.
Nucleic Acid Purity Checks
• Nucleic acids extracted from cells are accompanied by protein, and extensive purification is required to
separate the protein impurity. The 260/280 ratio gives an indication of purity; it is only an indication, however,
and not a definitive assessment. Pure DNA and RNA preparations have expected ratios of
≥ 1.8 and ≥ 2.0,
respectively; deviations from this indicate the presence of impurity in the sample, but care must be taken in
interpretation of results.
• The 260 nm reading is taken near the top of a broad peak in the Absorbance spectrum for nucleic acids,
whereas the 280 nm reading is taken on a steep slope (i.e. small changes in wavelength cause large changes
in absorbance). Consequently, small variations in wavelength at 280 nm will have a greater effect on the
260/280 ratio than variations will at 260 nm. Thus different instruments may give slightly different ratios due to
variations in wavelength accuracy, however, each instrument will give consistent results within itself.
• Concentration also affects 260/280 readings. If a solution is too dilute, the readings will be at the instrument’s
detection limit, and results may vary as there is less distinction of the 260 peak and 280 slope from the
background absorbance. This is one reason why the Abs260 value should be greater than 0.1 for accurate
measurements.
• An elevated absorbance at 230 nm can indicate the presence of impurities as well; 230 nm is near the
absorbance maximum of peptide bonds and also indicates buffer contamination since Tris, EDTA and other
buffer salts absorb at this wavelength. When measuring RNA samples, the 260/230 ratio should be > 2.0; a
ratio lower than this is generally indicative of contamination with guanidinium thiocyanate, a reagent commonly
used in RNA purification and which absorbs over the 230 - 260 nm range. A wavelength scan of the nucleic
acid is particularly useful for RNA samples.
• The instrument can display 260/280 and 260/230 ratios, and compensates for dilution and use of cells that do
not have 10 mm pathlength; dilution factor and cell pathlength can be entered.