Chart – Super Systems PH2 User Manual
Page 4
3
SSi Portable Hydrogen Analyzer
Rev A
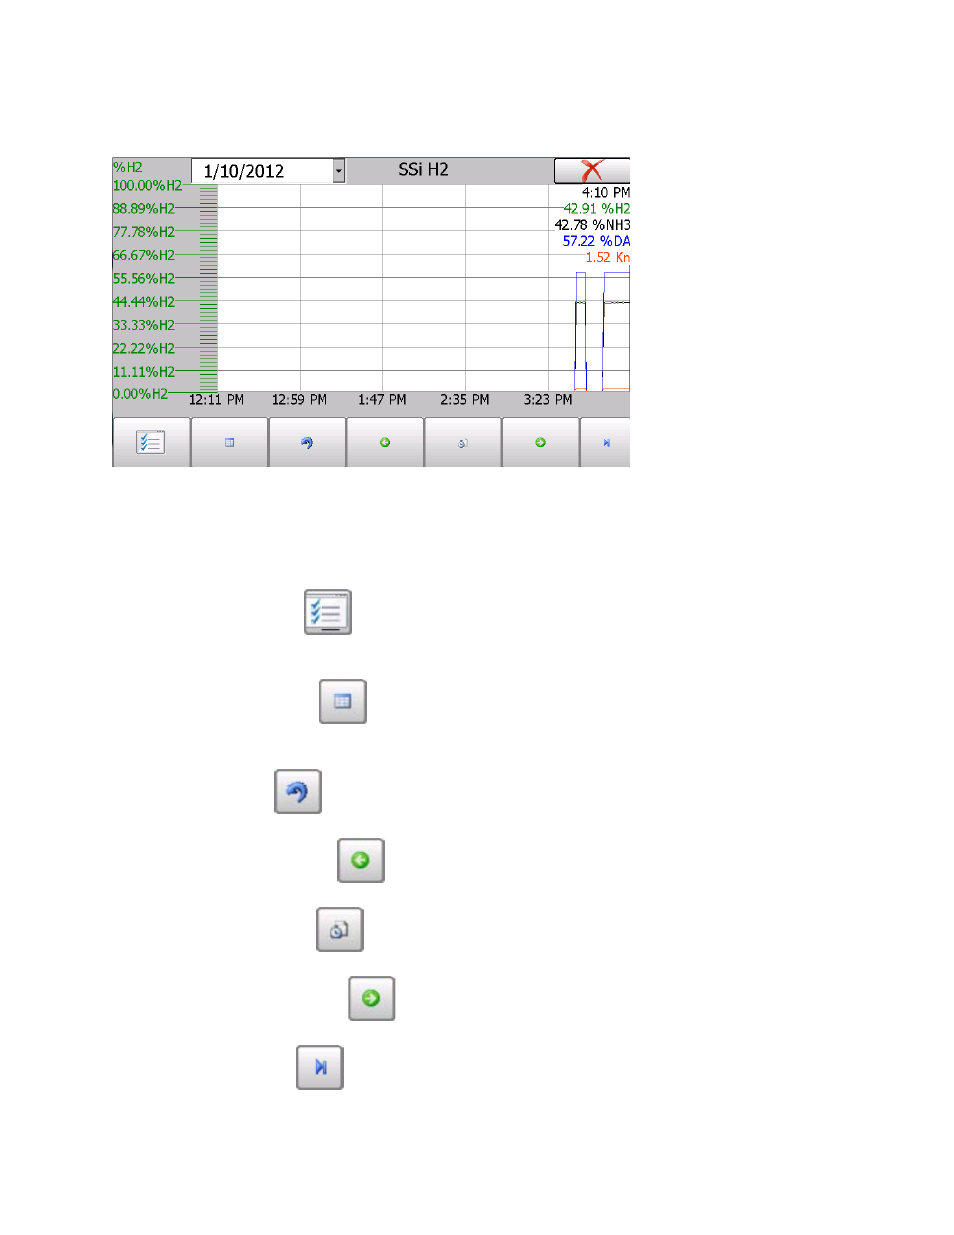
Chart
The Chart Display shows between 1 hour and 24 hours of process variable data on the screen
and can be scrolled back to view all of the data stored on the hard drive. The vertical timelines
change as the time changes on the screen.
The function buttons run along the bottom of the screen.
The Trend Lines button -
- will allow the user to select or de-select the trend lines on the
trend chart to display. If the checkbox next to each trend line is checked, then that trend line
will be displayed.
The Datagrid View button -
- will display a screen with the trend data in a grid format
instead of with trend lines. The trend data is shown in 1-minute intervals. Clicking on the OK
button on this screen will close the screen down and return to the Chart Display screen.
The Refresh button -
- will refresh the screen’s trend data if the screen is not in real-
time mode.
The left green arrow button -
- will move the chart’s view backward in time by the
specified chart interval.
The chart interval button -
- will determine the number of hours displayed on the trend
chart. The options are: 1 Hour, 2 Hours, 4 Hours, 8 Hours, 12 Hours, or 24 Hours.
The right green arrow button -
- will move the chart’s view forward in time by the
specified chart interval.
The blue arrow button -
- will toggle real-time mode on and off. When in real-time mode,
the chart will automatically be updated once a minute.