Evaluation of results, Body fat percentage, Body weight / body mass index – Beurer BF 300 User Manual
Page 11
11
5. Evaluation of results
Body fat percentage
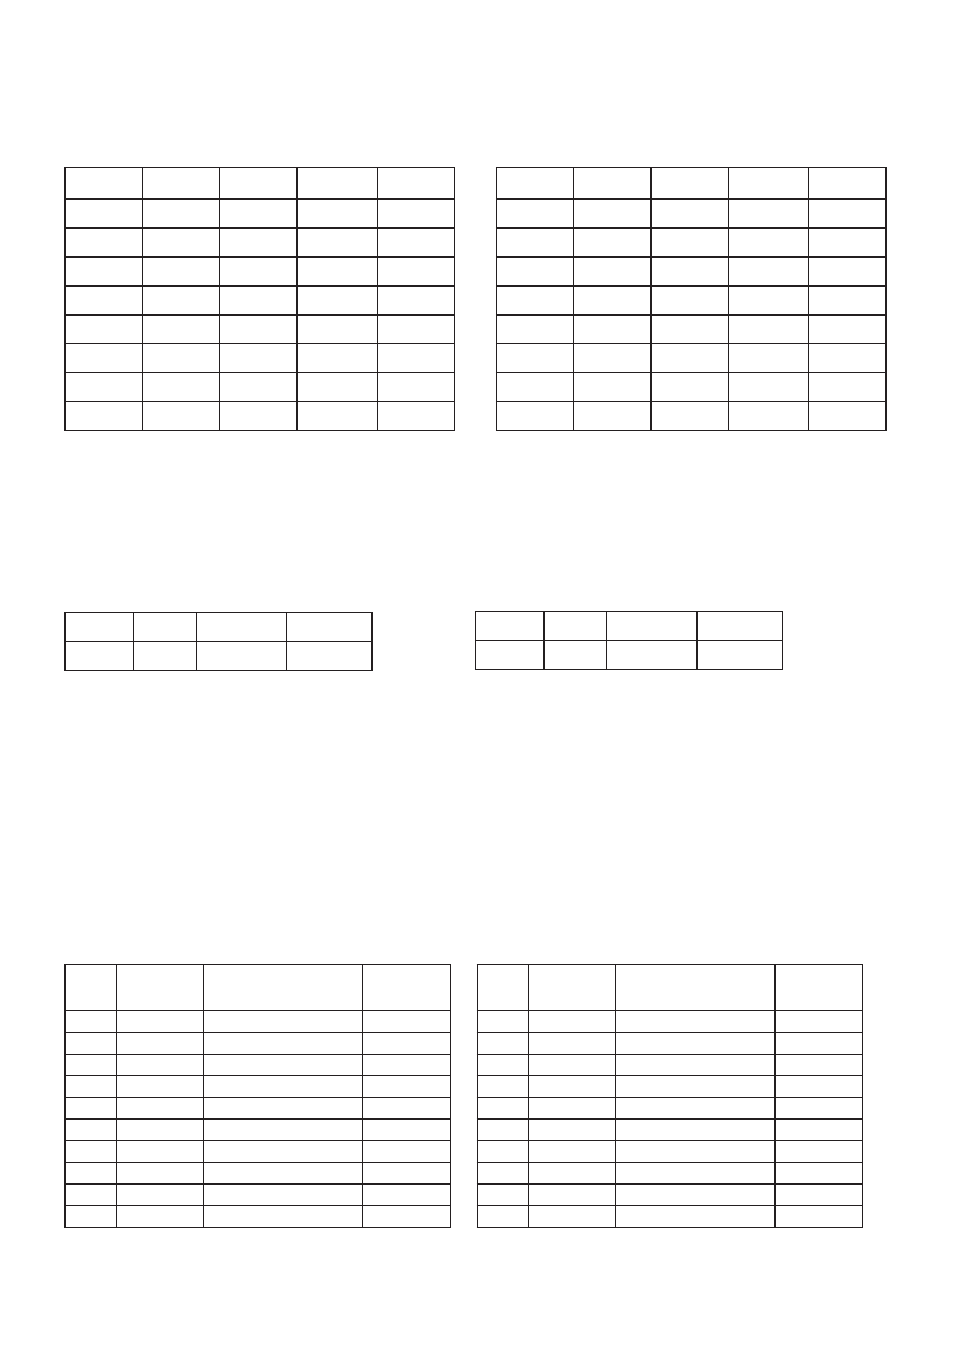
The following body fat percentages are for guidance (contact your physician for further information).
Man Woman
Age
very good good
average
poor
10-14
<11%
11-16%
16,1-21%
>21,1%
15-19
<12%
12-17%
17,1-22%
>22,1%
20-29
<13%
13-18%
18,1-23%
>23,1%
30-39
<14%
14-19%
19,1-24%
>24,1%
40-49
<15%
15-20%
20,1-25%
>25,1%
50-59
<16%
16-21%
21,1-26%
>26,1%
60-69
<17%
17-22%
22,1-27%
>27,1%
70-100
<18%
18-23%
23,1-28%
>28,1%
Age
very good good
average
poor
10-14
<16%
16-21%
21,1-26%
>26,1%
15-19
<17%
17-22%
22,1-27%
>27,1%
20-29
<18%
18-23%
23,1-28%
>28,1%
30-39
<19%
19-24%
24,1-29%
>29,1%
40-49
<20%
20-25%
25,1-30%
>30,1%
50-59
<21%
21-26%
26,1-31%
>31,1%
60-69
<22%
22-27%
27,1-32%
>32,1%
70-100
<23%
23-28%
28,1-33%
>33,1%
A lower value is often found in athletes. Depending on the type of sports, training intensity and physical
constitution, values may result which are below the recommended values stated.
It should, however, be noted that there could be a danger to health in the case of extremely low values.
Body water:
The body water percentage is normally within the following ranges:
Man
Woman
Age
poor
good
very good
10-100
<50%
50-65%
>65
Age
poor
good
very good
10-100
<45%
45-60%
>60
Body fat contains relatively little water. Therefore persons with a high body fat percentage have body wa-
ter percentages below the recommended values. With endurance athletes, however, the recommended
values could be exceeded due to low fat percentages and high muscle percentage.
Body water measurement with this scale is not suitable for drawing medical conclusions, for example con-
cerning age-related water retention. If necessary ask your physician.
Basically, a high body water percentage should be the aim.
Body weight / Body mass index
The body mass index (BMI) is a number that is often called upon to evaluate body weight. The number is
calculated from body weight and height, the formula is – body mass index = body weight : height². The
measurement unit for BMI is [kg/m²].
Man < 20 years
Woman < 20 years
Age Under-
weight
Normal weight
Over-
weight
Age Under-
weight
Normal weight
Over-
weight
10
12,7 – 14,8
14,9 –18,4
18,5 – 26,1
10
12,7 – 14,7
14,8 –18,9
19,0 – 28,4
11
13,0 – 15,2
15,3 –19,1
19,2 – 28,0
11
13,0 – 15,2
15,3 –19,8
19,9 – 30,2
12
13,3 – 15,7
15,8 –19,8
19,9 – 30,0
12
13,3 – 15,9
16,0 – 20,7
20,8 – 31,9
13
13,7 – 16,3
16,4 – 20,7
20,8 – 31,7
13
13,7 – 16,5
16,6 – 21,7
21,8 – 33,4
14
14,2 – 16,9
17,0 – 21,7
21,8 – 33,1
14
14,2 – 17,1
17,2 – 22,6
22,7 – 34,7
15
14,6 – 17,5
17,6 – 22,6
22,7 – 34,1
15
14,6 – 17,7
17,8 – 23,4
23,5 – 35,5
16
15,0 – 18,1
18,2 – 23,4
23,5 – 34,8
16
15,0 – 18,1
18,2 – 24,0
24,1 – 36,1
17
15,3 – 18,7
18,8 – 24,2
24,3 – 35,2
17
15,3 – 18,3
18,4 – 24,4
24,5 – 36,3
18
15,6 – 19,1
19,2 – 24,8
24,9 – 35,4
18
15,6 – 18,5
18,6 – 24,7
24,8 – 36,3
19
15,8 – 19,5
19,6 – 25,3
25,4 – 35,5
19
15,8 – 18,6
18,7 – 24,9
25,0 – 36,2