Pressure drop chart cb 2, Fig. 4 – Flowserve CB 1 User Manual
Page 7
Advertising
7
Pressure Drop Chart CB 2...
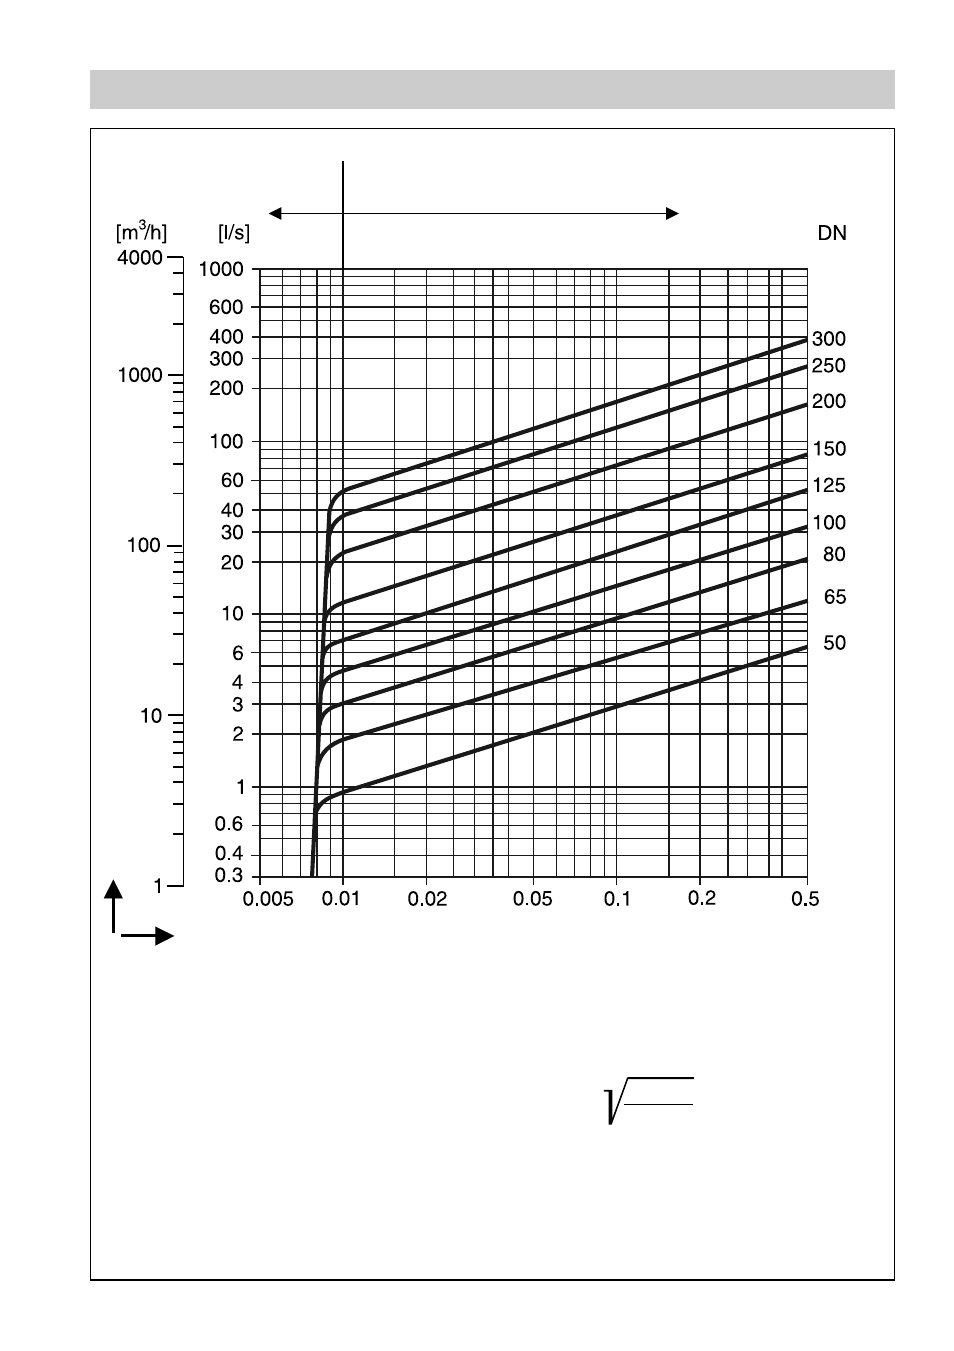
Fig. 4
V˙
w
= V˙ ·
V˙
w
= Equivalent water volume flow
in [l/s] or [m³/h]
ρ = Density of fluid (operating condition)
in kg/m³
V˙
w
= Volume of fluid (operating condition)
in [l/s] or [m³/h]
ρ
1000
The curves given in the chart are valid for
water at 20 °C. To read the pressure drop for
other fluids the equivalent water volume
flowrate must be calculated and used in the
graph.
The values indicated in the chart are applicable
to valves with horizontal flow. With vertical
flow insignificant deviations occur only within
the range of partial opening.
Pressure drop
∆p [bar]
Volume flow
V˙
w
Partial opening
= instable range
Full opening
= stable range
Advertising
This manual is related to the following products: