La Crosse Technology WS-1913 User Manual
Page 21
21
NOTE:
Once the weather tendency indicator has registered a change in air pressure, it will remain
permanently visualized on the LCD.
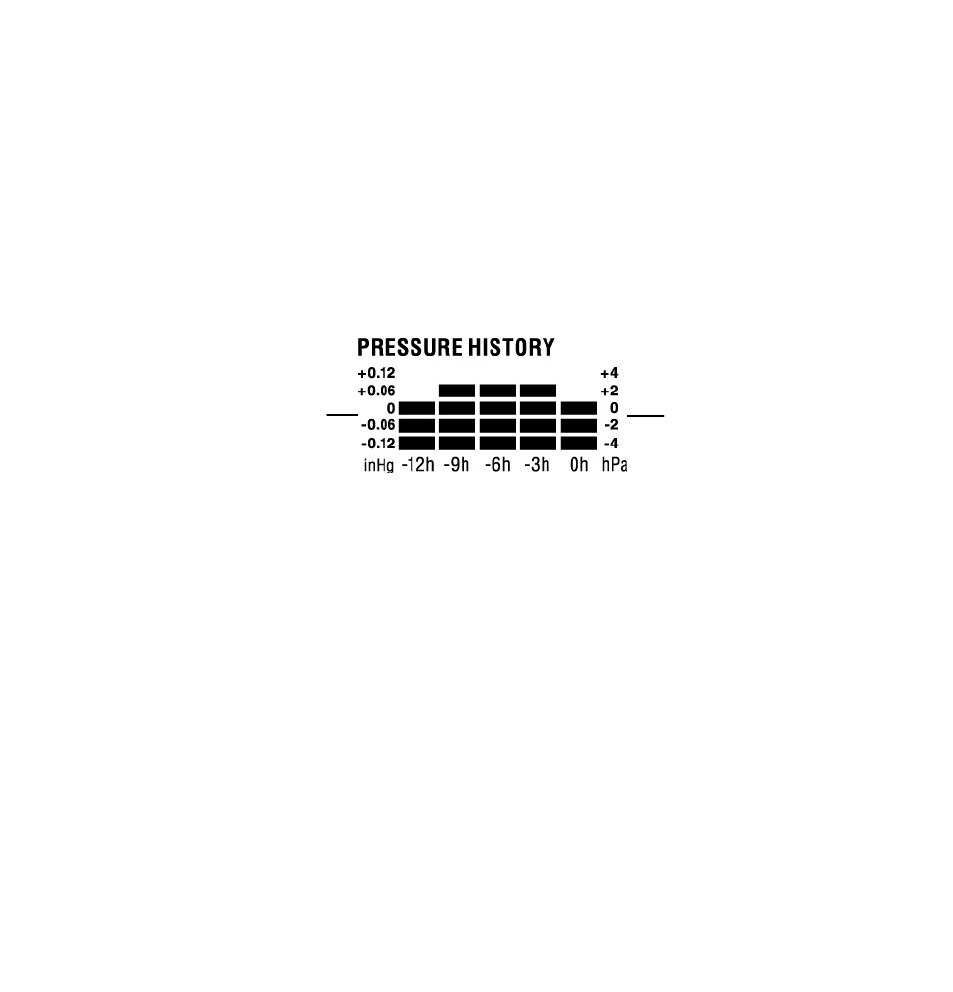
AIR PRESSURE HISTORY (ELECTRONIC BAROMETER WITH
BAROMETRIC PRESSURE TREND)
The bottom section of the LCD also shows the relative air pressure value and the air
pressure history.
The bar graph of the electronic barometer shows the air pressure history of the past 12
hours in five 3-hour steps.
The horizontal axis represents the last 12 hours air pressure recording (-12, -9, -6, -3 and
0 hour). The bars are plotted at each of the 5 steps and give the trend over the recorded
period. The scale on the right compares the result. The "0" in the middle of this scale
determines the current air pressure.
The vertical axis represents the air pressure changes in inHg (+0.12, +0.06, 0, -0.06, -0.12.
The “0” represents the current air pressure). The newly measured pressure was compared
to the previously recorded pressure reading. The pressure change is expressed by the
difference between the current ("0h") and the past readings in division of ±2 hPa or ±0.06
inHg. If the bars are rising it indicates that the weather is getting better due to an increase
in air pressure. If the bars go down it indicates a drop of the air pressure and the weather
is expected to get worse from the present time "0".
At every full hour, the current air pressure is used as a basis for the display of a new graph
bar. The existing graph is then moved one column to the left.
NOTE:
For accurate barometric pressure trend, the Weather Center should operate at the same
altitude. For example, it should not be moved. Should the unit be moved, for instance from
Air pressure
changes in inHg
Air pressure
changes in hPa