Signal duration – Wavecom W-BitView V2.5.00 User Manual
Page 62
56
Function Library
BitView Manual V2.5.00 WAVECOM W-BV
This chart is only calculated once, i.e., the content does not change, even if the analysis set is
recalculated. To update graph values, close the window and then reopen it.
Built-in zoom functions that are available by using mouse clicks.
A drag-and-drop operation will select an area for zooming.
A right click on the display makes additional functionality available.
If the view has been changed by drag and drop, the original dimensions can be restored by clicking
Original Dimensions.
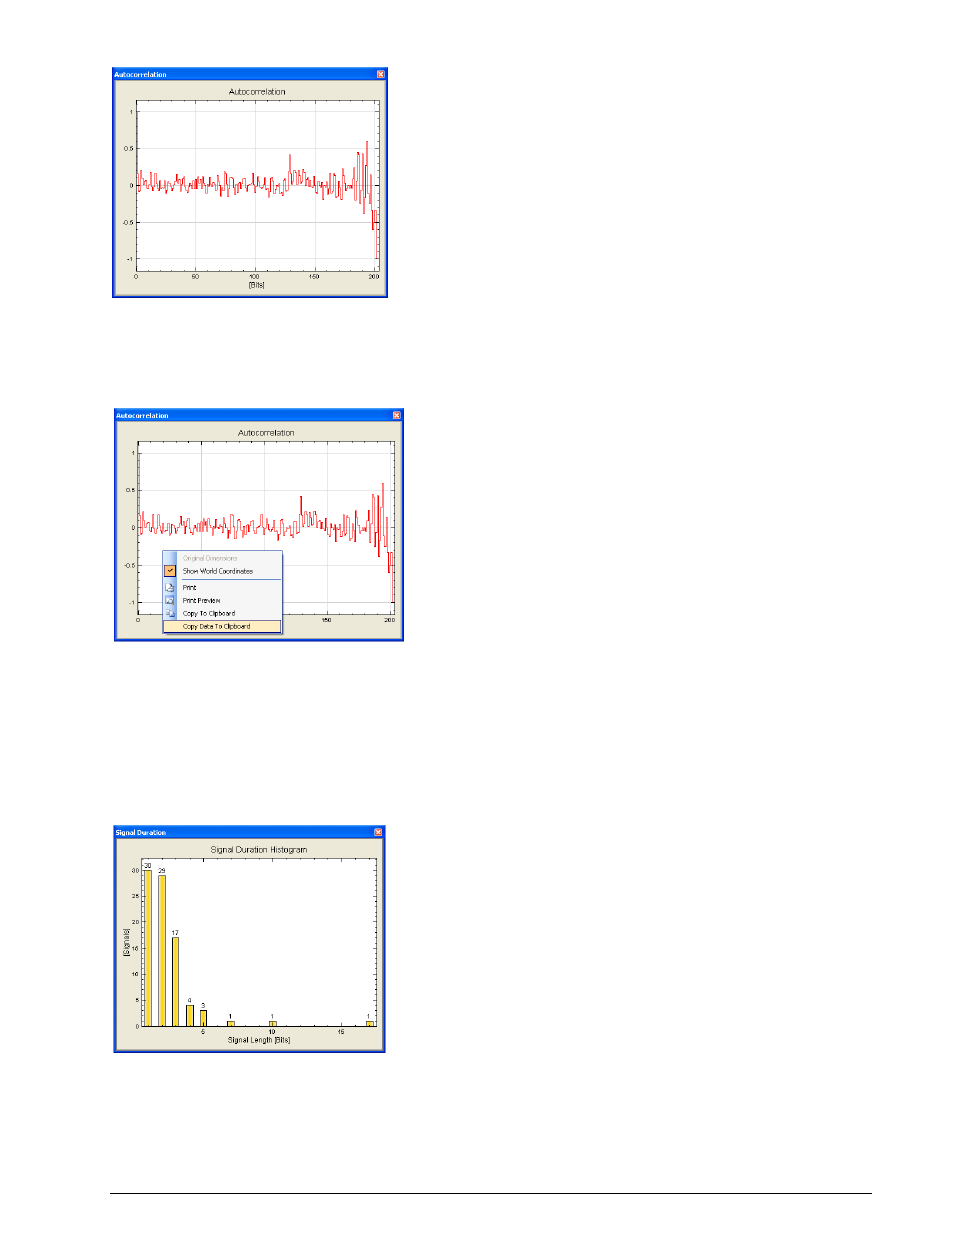
Signal Duration
In: Bit stream
Out: Histogram
Function:
Generates a statistical histogram of signal duration.
This chart is only calculated once, i.e., the content does not change, even if the analysis set is
recalculated. To update histogram values, close the window and then reopen it.
A drag-and-drop operation will select an area for zooming.
A right click on the display makes additional functionality available.