X-Treme Audio HPS User Manual
Page 4
This does not mean the acoustic pressure will be distributed
throughout the space as and how we would like: this will probably
not happen. However, it is a good notion to bear in mind, espe-
cially when there are few sw’s available.
• Fitting the sw’s in a flying configuration, (typically above line array
modules) may result in some unpleasant surprises due to the lack
of a nearby, reinforced ceiling: the pressure on the low frequen-
cies may not come up to expectations and require an unfeasible
number of units.
• Any walls close to the subwoofers should be taken into proper
consideration: “feared” but potential for exploitation.
6. Examples and simulations with the X-Treme Installer
We have seen how combing explains the phenomena of sw pairing.
Now we are providing a few examples of “virtual” installation using a
software tool whose algorithm is based on this phenomenon.
This is
XTI free field acoustic prediction software, a tool specifically
created for X-Treme products. This software was created for line ar-
ray predictions where combing is an even more important element in
the characteristic emission patterns and should not be overlooked in
any acoustic prediction. The predictions illustrated (Figures 3 and 4)
refer to two actual installations (Figures 5 and 6) carried out at Sound
Corporation’s metrological laboratory.
The subwoofer used in this case is the
XTMISIS: a subwoofer with
2400 watt RMS absorbed power, normally linked to the MISI
TM
line
array (middle of the range in terms of the size and power of the three
array products made by X-Treme). In the workshop, 6 units are used,
eliminating the problem of delivering sufficient acoustic power at
source but more importantly offering the potential of working with a
degree of complexity in terms of spatial configuration and thus the
distribution of the sound.
Here, we compare two possible types of installation on the ground
(Figures 5 and 6):
a) two clusters of 3 units each, stacked;
b) a horizontal array of 6 units.
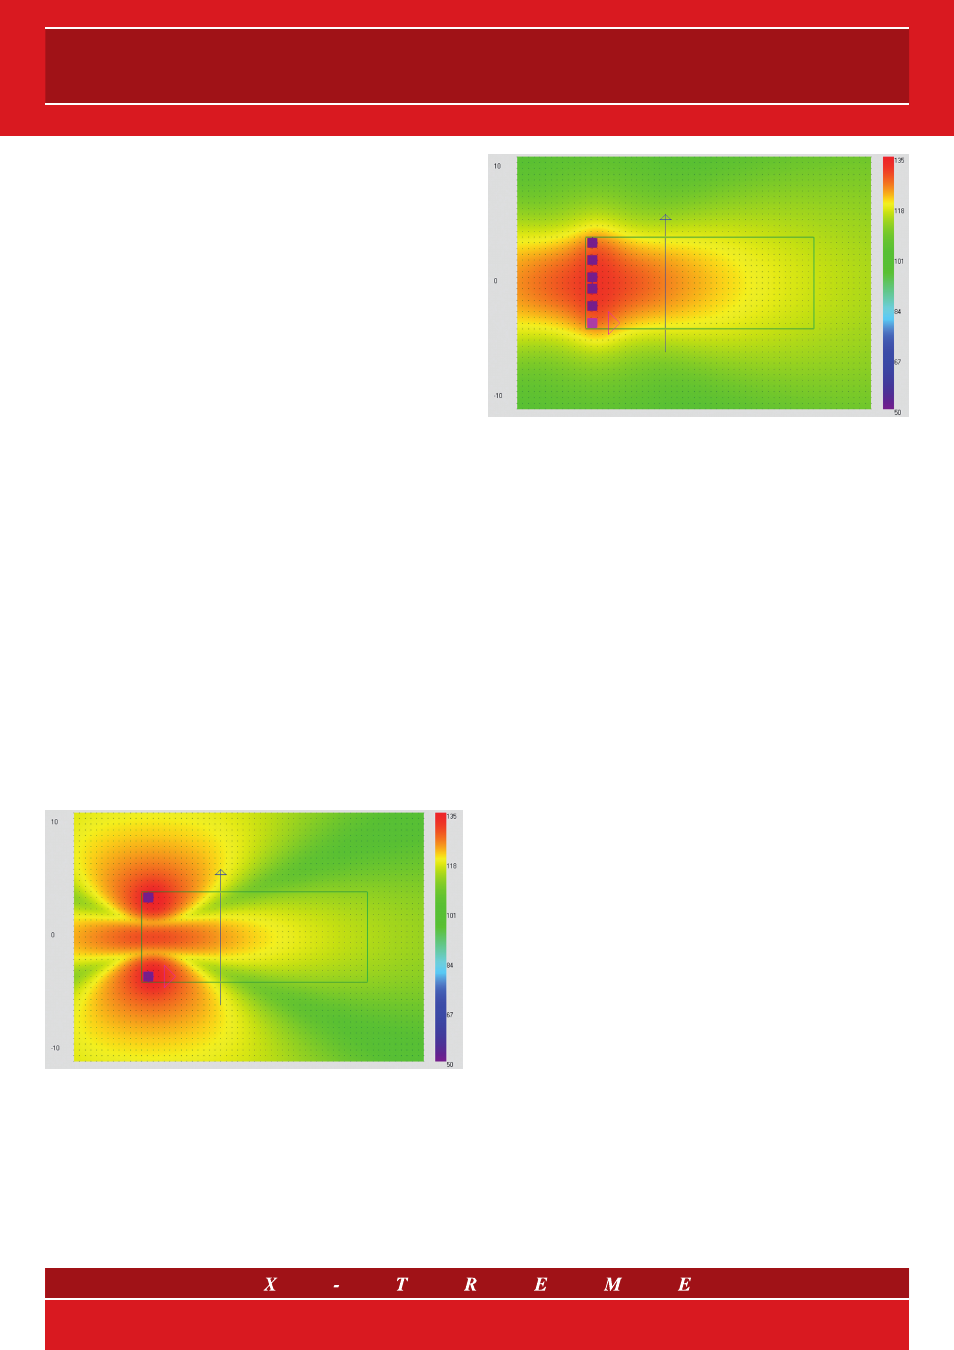
Fig. 3 Acoustic prediction for two clusters of 3 units
Fig. 4 Acoustic prediction for an array of 6 units
In both cases, the subwoofers are located close to the back wall.
The room’s floor plan is the rectangle that is drawn inside the XTI;
the plotted maps represent the level of pressure limited to the 63 Hz
octave (from 45 to 90 Hz approximately), calculated from the total of
the combing figures on twelve discrete frequencies distributed within
it (semitones). The prediction is limited to free field, but it will also
be used to forecast the resulting interaction with the environment (a
more detailed study could also create the main image sources and
see the effect directly).
Solution a) with two lateral clusters is often preferred by the FOH
technicians: in a touring installation they are typically located under
the upper left and right modules of the sound reinforcement system.
This is because it combines the concept of high performance and
that of phase coherence with the satellites across the whole space.
However, it does not consider the phase coherence between the
subwoofers nor the resulting problem of the combing lobes and the
overall distribution of the pressure level.
The prediction illustrated in Figures 3 and 4 clearly shows the prob-
lem of the lobes as well as the strong lateral emission; bearing the
lateral reflection in mind, this will result in excess energy being “re-
strained” close to the installation itself (not being projected forwards)
so that the result is a certain amount of wasted power output.
The pressure level performance shown in Figure 7 is measured along
a straight oblique line, highlighted by an arrow in the XTI screens: we
can see that the combing “gaps” are clearly marked (naturally they
are less than they would be in free field) despite the “randomisation”
introduced by environmental reflection.
The phenomenon is clearly audible when walking along the same line
and listening to music: the attractive and well-defined “boom boom”
of our XTMISIS decays at the incriminated points, slightly yet taunt-
ingly; a question of few, but truly important decibels.
Otherwise, the prediction for installation b) with a horizontal array
shows a main lobe that is well adapted to the room’s more elongated
layout compared to the previous example, suggesting the possibil-
ity of greater penetration of direct sound in depth (so less loss and
higher definition), as well as the elimination of those annoying gaps.
4/6