User’s manual – X-Treme Audio HPS User Manual
Page 5
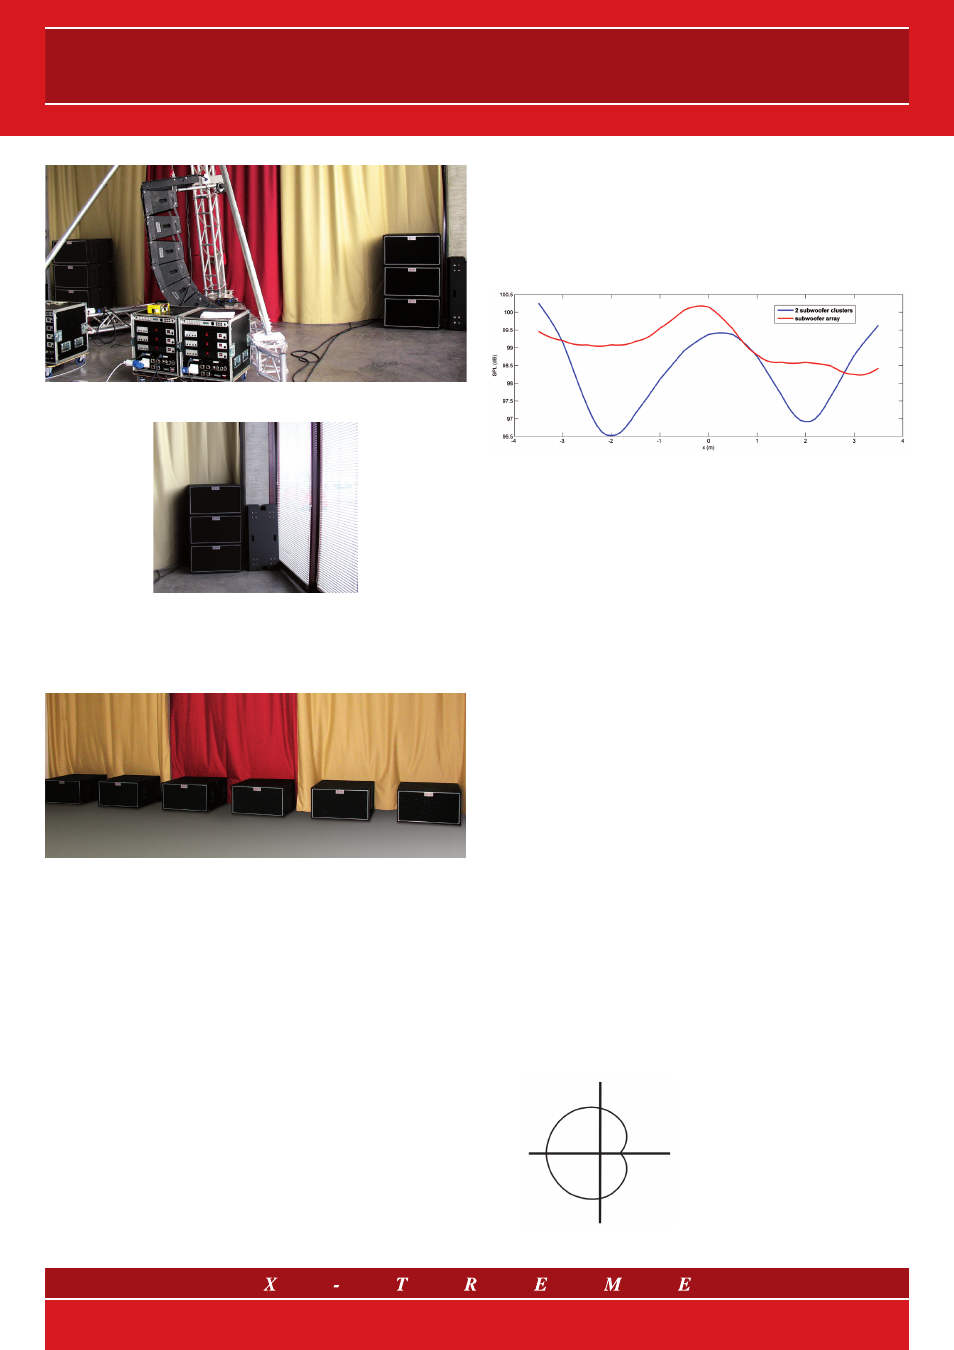
Fig. 5 Installation a) consisting of two clusters of 3 subwoofers each
Fig. 5 bis Detail of the glass wall
The “in the field” measurements and listening (Figure 7) generally
confirm the prediction made with the XTI (Figures 3 and 4), showing
the excellent potential of this approach.
Fig. 6 Installation b) consisting of 6-unit sub array
For both installations, note the asymmetry of the level caused by
the glass wall on the right (Figure 5 bis) that transmits part of the
incident sound outside (and so does not reflect it back). For these
frequencies, the roughness of the surface is not as important as the
mass and the stiffness of the wall. Therefore, in this case, the dB
“received” from the wall by the overall acoustic pressure level will be
much less than 5. In particular, in case b) we can say that this asym-
metry disturbs the desired effect of uniformity: two perfectly reflecting
side walls would result in a system (consisting of the actual array plus
its virtual images) corresponding to an infinite array with a significant
improvement in uniformity. We might consider an active method of
compensating for this imbalance by altering the gain of the individual
subwoofers; in actual fact, the multi-channel process offers a range
of interesting solutions especially for sw arrays that should be dis-
cussed in a separate technical paper.
The same goes for the analysis of transients, which should complete
this study. For now, we have only studied the stationary state and have
discussed the effects that this study may bring to light.
Further analysis of the effects of the geometrics of installation on
the phase transfer function would be equally important, because it
would provide more specific information on the quality and not just the
“quantity” of the sound reproduced by the subwoofers. This is pos-
sible thanks to the measurement of the system’s impulse response
and is part of the current research projects of the R&D team at Sound
Corporation.
Fig. 7 Sound pressure level on the transverse line
at 8 m from the system
7. X-Treme Subwoofers: product catalogue
Rather than developing a product merely to achieve a beautiful design
(which often does not guarantee a high quality reproduced sound) or
to follow some production efficiency criteria, the X-Treme designers
created the
High Power Subwoofers (mod. XTHPS21, XTHPS33,
XTHPS36 and XTHPS36/A) only taking into account the functionality
of these products and their final application: reproducing ultra-low fre-
quencies with unequalled efficiency and performance in the profession-
al audio, in the case of both indoor and outdoor great musical events.
Perfect compensation of the masses and volumes, together with re-
inforcements inside the cabinet, completely eliminates vibrations and
maintains the subwoofer characteristics unchanged over time. The
SPL peak is reached at 80 Hz, the volume of air displaced by 15” or
18” components and the structural rigidity of the Canadian birch cabi-
nets make the sound reinforcement always deep, round and diffused.
To sum up: an incisive and deep “big punch”.
The XTCARDIOID model should be dealt with separately: in fact, it can
be defined as a controlled directivity “big punch” cardioid subwoofer.
But what do we mean by the term cardioid? In geometry the cardioid
is a curve (its name refers to its heart-like shape) and, more accurately,
an epicycloid with just one cusp – see figure 8. In the audio sector it
means that the polar diagram (that is the angular distribution graph of
a speaker system output level at a fixed distance and in the presence
of a constantly applied signal) at the working nominal frequency of
this subwoofer is of a “heart-shaped” type. This is achieved by con-
trolling the element components with a power amplifier (for example
the XTDT6000F model) and a control processor (such as the XTDP26
model) to manage the delay, in order to combine the response of the
two front bi-directional 18” loudspeakers with that of the rear omni-
directional one. The resulting polar diagram looks like a heart, with a
peaked anisotropy in the front direction and a minimum response in
the rear direction.
Fig. 8 Illustration
of the XTCARDIOID
polar pattern
5/6