ETA Helen User Manual
Page 26
Notice
There must not be a contact between feet, calves or thighs. Otherwise the
measurement could be inaccurate.
!
For a repeated analysis of body characteristics (after saving the input data of the person
to the memory – e.g.
1), proceed as follows:
1) Press and hold the
SET button (if you were using the scale in the regular weighing mode)
or turn on the scale with the
SET button.
2) Choose the number of memory with the or button where your setting is saved.
3) Do not press anything after selecting the respective number of memory (wait till 0.0 appears).
Step on the scale and your weight and bodily characteristics will begin to be analyzed.
Note: The scale remembers the results of the last analysis. To recall them, press SET. By
pressing the or button, select the number of memory which your setting is saved in. Do
not press anything after selecting the desired number. When 0, 0 appears, the scale is ready
for an analysis, do not step on it, but display the previous results with the or button.
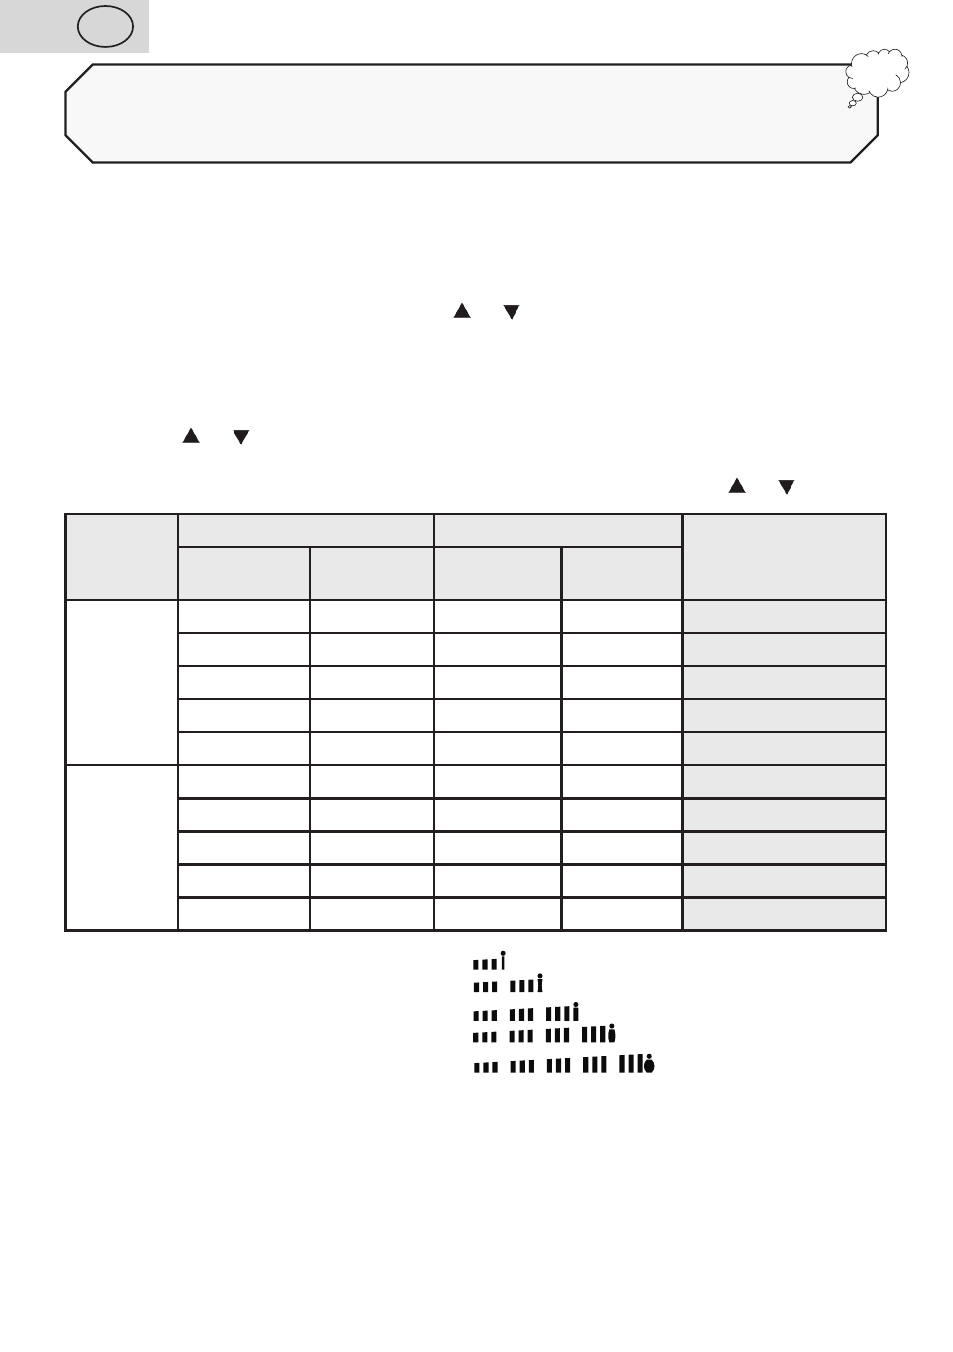
Age
Female
Male
Status
Fat
(%)
Hydration
(%)
Fat
(%)
Hydration
(%)
< = 30
4 – 16
66 – 57.8
4 – 11
66 – 61.2
major underweight
16.1 – 20.5 57.7 – 54.7 11.1 – 15.5 61.1 – 58.1
underweight
20.6 – 25
54.6 – 51.6
15.6 – 20
58 – 55
normal
25.1 – 30.5 51.5 – 47.8 20.1 – 24.5 54.9 – 51.9
overweight
30.6 – 60
47.7 – 27.5
24.6 – 60
51.8 – 27.5
obese
> 30
4 – 20
66 – 55
4 – 15
66 – 58.4
major underweight
20.1 – 25
54.9 – 51.6 15.1 – 19.5 58.3 – 55.3
underweight
25.1 – 30
51.5 – 48.1
19.6 – 24
52.2 – 52.3
normal
30.1 – 35
48 – 44.7
24.1 – 28.5 52.2 – 49.2
overweight
35.1 – 60
44.6 – 27.5
28.6 – 60
49.1 – 27.5
obese
Major underweight indicator (on scale):
Underweight indicator (on scale):
Normal weight indicator (on scale):
Overweight indicator (on scale):
Obesity indicator (on scale):
For the reason of differences between people, this table is only informative. Always consult
your attending physician if any measuring results are abnormal.
The results of measuring bones’ weight and muscular proportions are simply tentative.
Healthy man has approximately 40% of muscular proportion and healthy woman has 30%
according to an average ratio. Women´s weight of bones is among 12 % and men´s weight of
bones is among 15 % but it depends on many relevant factors.
GB
26 / 45