Starting an acquisition, Viewing spectral bands, Plotting data – Measurement Computing eZ-TOMAS rev.11.0 User Manual
Page 20: Multiple plots
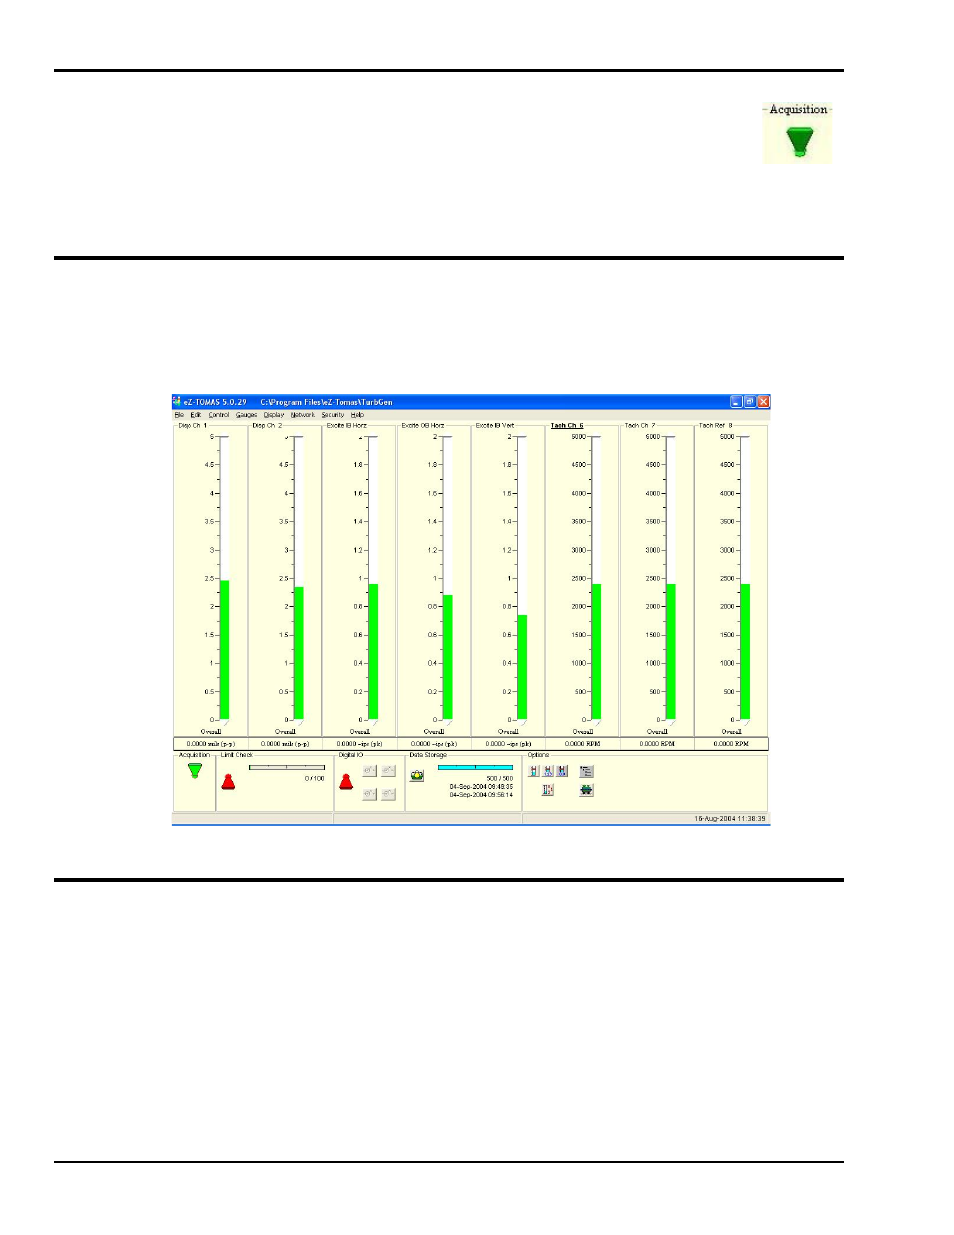
Starting an Acquisition
After you configure your eZ-TOMAS Project, click the <Acquisition> Toggle Switch to
place it in the upright position. This starts the data acquisition. The switch is located in the
in the lower left corner of the eZ-TOMAS gauge window.
When acquisition is active, real time overall values are displayed in the instrument gauges.
The toggle switch is green while data acquisition is active.
To stop data acquisition, click the switch toggling it down (red).
Viewing Spectral Bands
The Main Window’s gauges can be used to display different spectral bands. On the View menu select the
band of interest, e.g., Overall, DC Gap V, 1x Amp, 1x Phase, or one of the User Defined bands. Note that
selecting 1x Amp or 1x Phase results in two gauge types. In both cases vertical gauges will display for
1x Amplitude and circular phase gauges will display for 1x Phase. This is done automatically since the two
spectral bands are closely related.
Spectral Bands
Plotting Data
Click on “Display” in the main window’s menu bar, then select “Plots.” The Data Display Window
will open. Note that you can double-click on a gauge to open the Data Display Window to plot data for
that specific channel.
Multiple Plots
1. On the File pull-down menu of the Plots window, select Open Plot Window.
This opens a second display window.
2. On the Window pull-down menu of the Plots window, select either Tile Vertically or
Tile Horizontally.
All display windows will be shown simultaneously.
2-6 Monitoring a Machine
987294
eZ-TOMAS