Polar displays – Measurement Computing eZ-TOMAS rev.11.0 User Manual
Page 69
Polar Displays
Polar Displays show vibration amplitude and phase lag on a polar plot format. The data is corrected for
probe location. Phase lag is opposite the direction of rotation. You can optionally display the “Runout”
compensated values by clicking the associated button (see figure). The compensation values are specified
for each channel in the setup configuration.
Runout Compensation is a vector math operation, in which the referenced first order amplitude and phase
vector is subtracted from the displayed first order vector.
Note: Only one channel can be shown on a Polar Display.
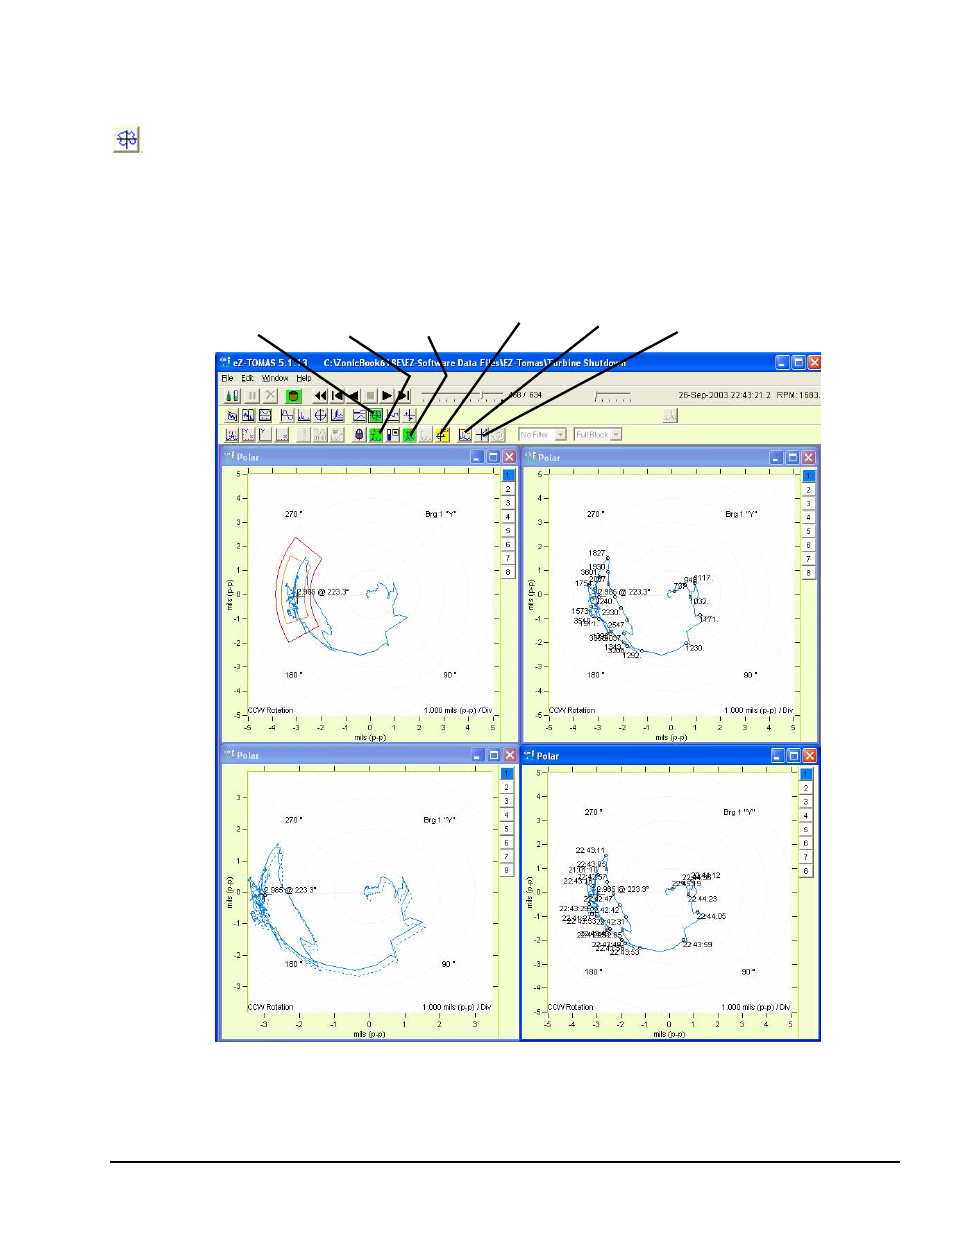
Display
Polar Cursor Cursor Update Annotation Overlay Runout
Display Values (Peak Search) Limits Compensation
Four Polar Plot Displays
In this figure the plot at the lower right has focus.
eZ-TOMAS
937594
Display Menu … Plots Plot Examples 7-7