Snmp details screen, Snmp details screen -55 – Verilink WANsuite 7105 (34-00316.C) Product Manual User Manual
Page 87
W e b S e r v e r I n t e r f a c e
3-55
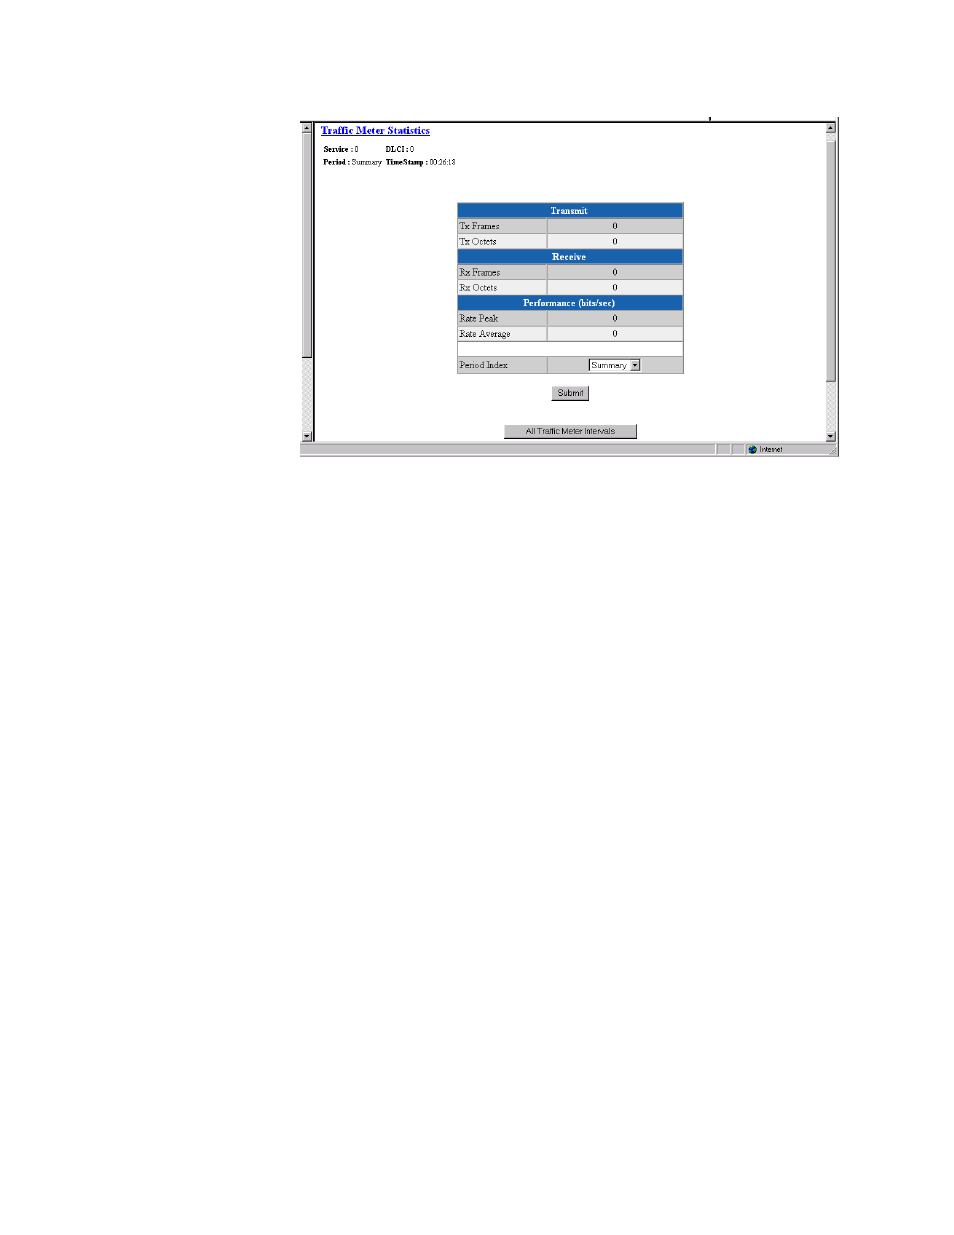
Figure 3.47
Traffic Meter Statistics Screen
The Traffic Meter Statistics screen reports on the following parameters:
•
Tx Frames
•
Tx Octets
•
Rx Frames
•
Rx Octets
•
Rate Peak – the peak data rate for the viewed period (see below)
•
Rate Average – the average data rate for the viewed period (see below)
The Period Index field is used to define the period of time for which the
Traffic Meter statistics will be reported. It represents the 24-hour, 15-minute
buckets index. Selecting a period and then clicking the “Submit” button will
display the traffic meter statistics for that period. Clicking on the “All Traffic
Meter Intervals” at the bottom of the screen displays the Traffic Meter
Statistics for all intervals as defined below.
Summary
Represents the past 24 hours; reports the additive number of frames/octets, the
highest peak encountered for 24 hours, and the average for 24 hours.
Current
Reports on the current 15-minute interval.
Interval 1, Interval 2,
..., Interval 96
Reports on Intervals 1-96, which correspond to the periods completed 15
minutes ago, 30 minutes ago, ..., 24 hours ago.
SNMP Details Screen
The unit detects and reports T1 alarms and provides several options for
reporting them, one of which is SNMP traps. When a network alarm occurs,
the unit sends a trap message to as many as eight destinations on your
network. The unit will report each alarm by transmitting an SNMP “trap” to