User’s manual – X-Treme Audio MISI User Manual
Page 6
Therefore, in a
linear source the in-axis response decreases by 3
dB for each doubling of the length instead of 6 dB as it occurs in a
con ventional speaker system (
point source) until the transition dis-
tance is reached, which at medium-high frequencies can be dozens
of metres for sources just a few metres long.
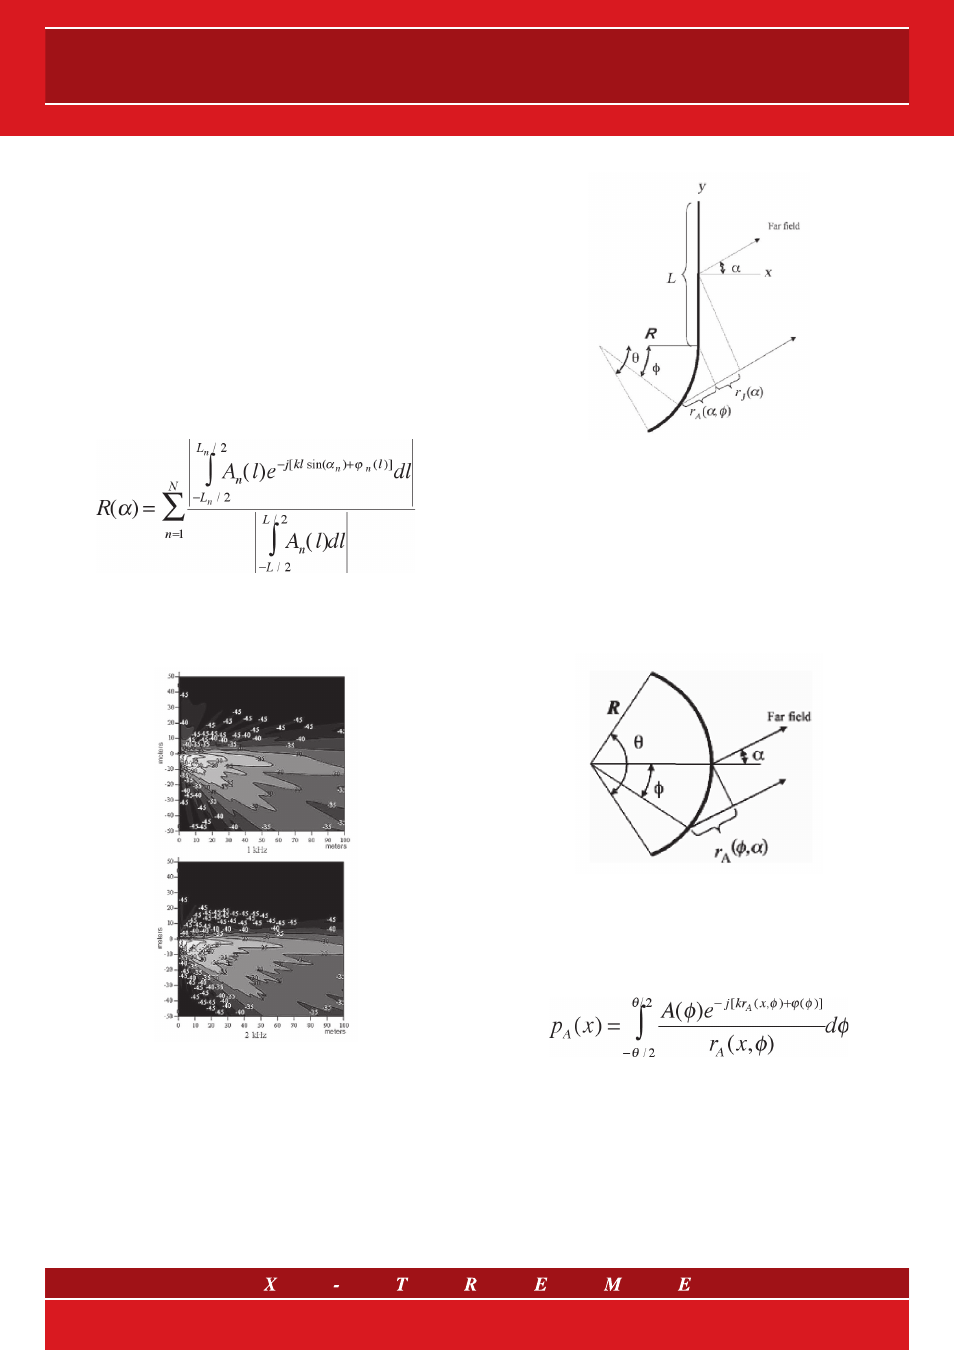
6. Arc, J and progressive sources
In a real configuration the wavefronts generated by the line array
should be adjustable to the variables of the listening space (number
and position of the listeners, listening space morphology, stage
dimensions) to reach, in theory, the maximum listening uniformity
from different positions.
The general formulation of the
directivity function, in case of N dif-
ferent sources, sums up the effects of these N (linear or not) sources
— the resulting function is as follows:
Given the freedom levels, this type of model can de scribe some
real situations in a simplified way, such as those in fig. 6, relating to
the measurement of a typical musical event with a line array sound
reinforcement system.
fig. 6
The directivity diagram as shown in fig. 6 can be used to approxi-
mately represent a specific case of the suggested general for mula,
where the sum has been reduced to two terms. The mathemati-
cal sum of these two terms represents the overlapping of half an
arc source (which will be analytically described later) and a linear
source. The resulting model is an important one, called J source.
Fig. 7 provides a further explanation of the link between the model
we are trying to improve with the analytical description and the line
arrays.
fig. 7
The formal calculation of the expressions relating to the J source,
despite having been substantially simplified, requires superfluous
complex steps. On the contrary, the qualitative analysis of the con-
tribution to directivity given by the lower semi-arc is quite interesting.
Similarly to the considerations made for the linear source, an ideal
arc source model can be created and the pressure expression can
be analysed.
fig. 8
Skipping the mathematical steps required to replace the variables
below the integral sign, we can write down directly the expression
of the acoustic pressure as:
from which the directivity function is obtained.
A qualitative analysis of the
polar diagrams of the arc source,
indicated in fig. 9, reveals the same dependency between the lobe
distribution and the frequency/arc length ratio noticed in the case of
the linear sources. As far as linear sources are concerned, however,
a greater width of the main lobe is observed as one can clearly see
from the polar pattern chart in the following figure.
6/21