Grass Valley Kaleido-Solo Installation v.2.04 User Manual
Page 44
GUIDE TO INSTALLATION AND OPERATION
40 | Kaleido-Solo
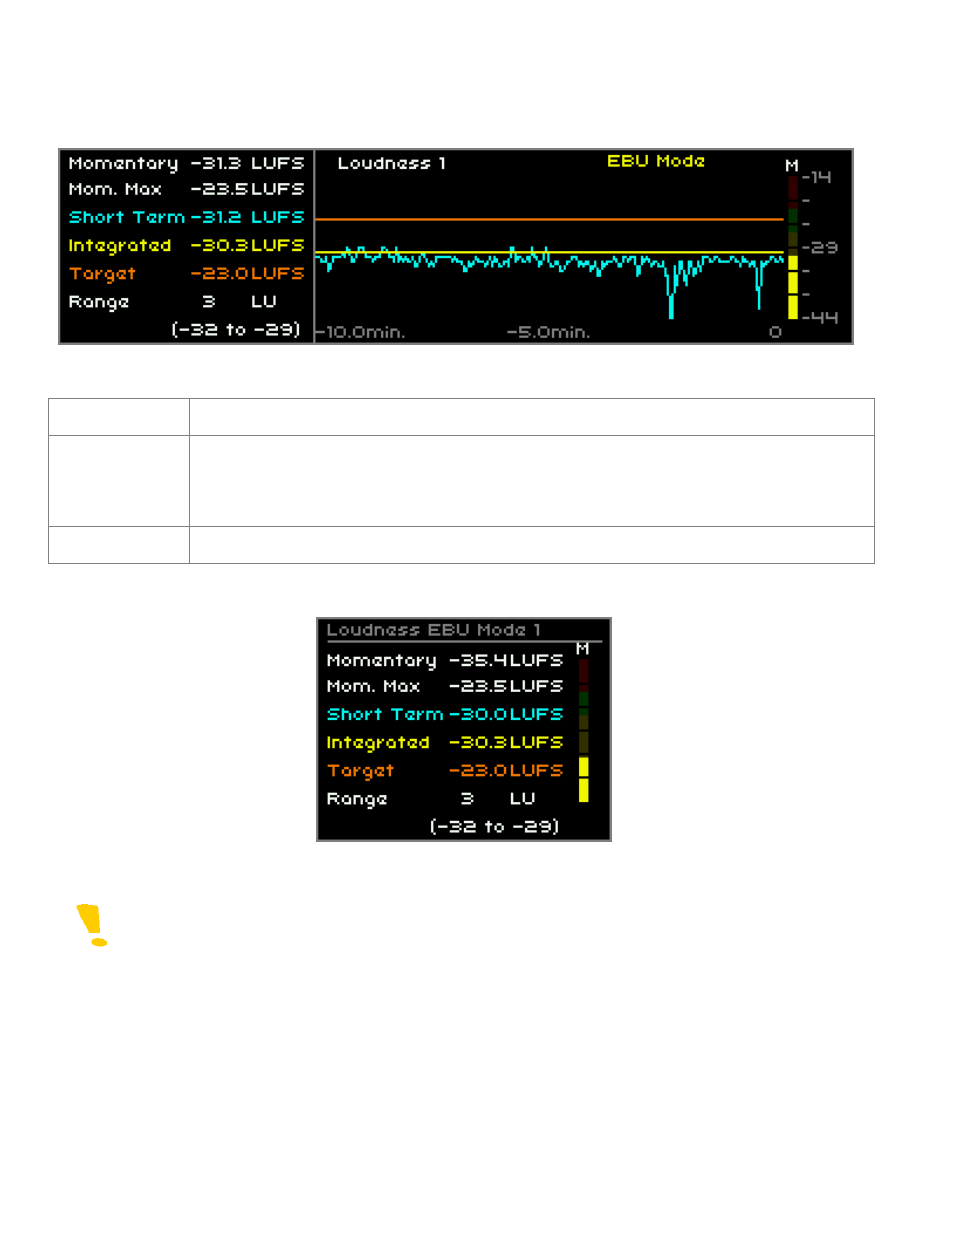
Loudness chart (full)
The color identifies the traces (center section) with their numeric values (left section).
Left section
Refer to EBU R128 or ATSC A/85 specification for more details.
Center section
Graphic representation of short term, integrated measurement and the target value. The time
scale is represented at the bottom of this section. Those traces can be independently shown or
hidden (see section 0).
The “EBU Mode or A85 Mode” is displayed only when the
measurements are compliant to those specifications (see section 5.4.5).
Right section
Meter that represents the momentary measurement.
Loudness chart (compact)
The compact form is represented by the left section of the full loudness chart combined with the momentary meter.
Note that the momentary scale in compact mode is fixed to +9.