Typical performance graphs – Linx Technologies TXM-xxx-LC User Manual
Page 5
Advertising
–
–
–
–
4
5
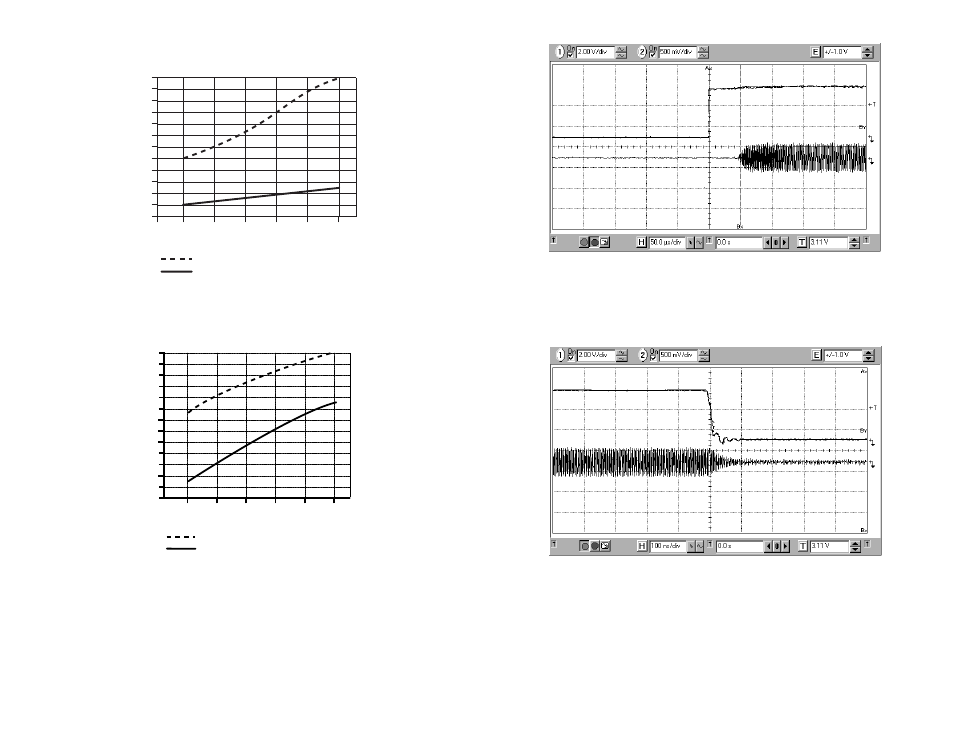
Typical Performance Graphs
2.5
3.0
3.5
4.0
4.5
5.0
Supply Voltage (V)
1
3
2
4
5
6
7
8
9
10
11
12
0
With 430
Ω resistor on LADJ
With LADJ tied to ground
Supply Current (mA)
0
-1
-4
-5
2.5
3.0
3.5
4.0
4.5
-2
-3
Supply Voltage (V)
+1
+3
+2
+4
+5
+6
+7
+8
5.0
With 430
Ω resistor on LADJ
With LADJ tied to ground
Output Power (dBm
)
Figure 5: Current vs. Supply Voltage
Figure 6: Output Power vs. Supply Voltage
Figure 7: Typical Oscillator Turn-On Time
Figure 8: Oscillator Turn-Off Time
Advertising