ABUS Technologies Log Box-DA Data Logger User Manual
Page 21
ABUS TECHNOLOGIES INC.
21
Log Box-DA
status bar indicates remaining data to be transferred. Data offloading time is proportional to the number
of readings logged. At the end of data transference, the Graph window is displayed as shown blow.
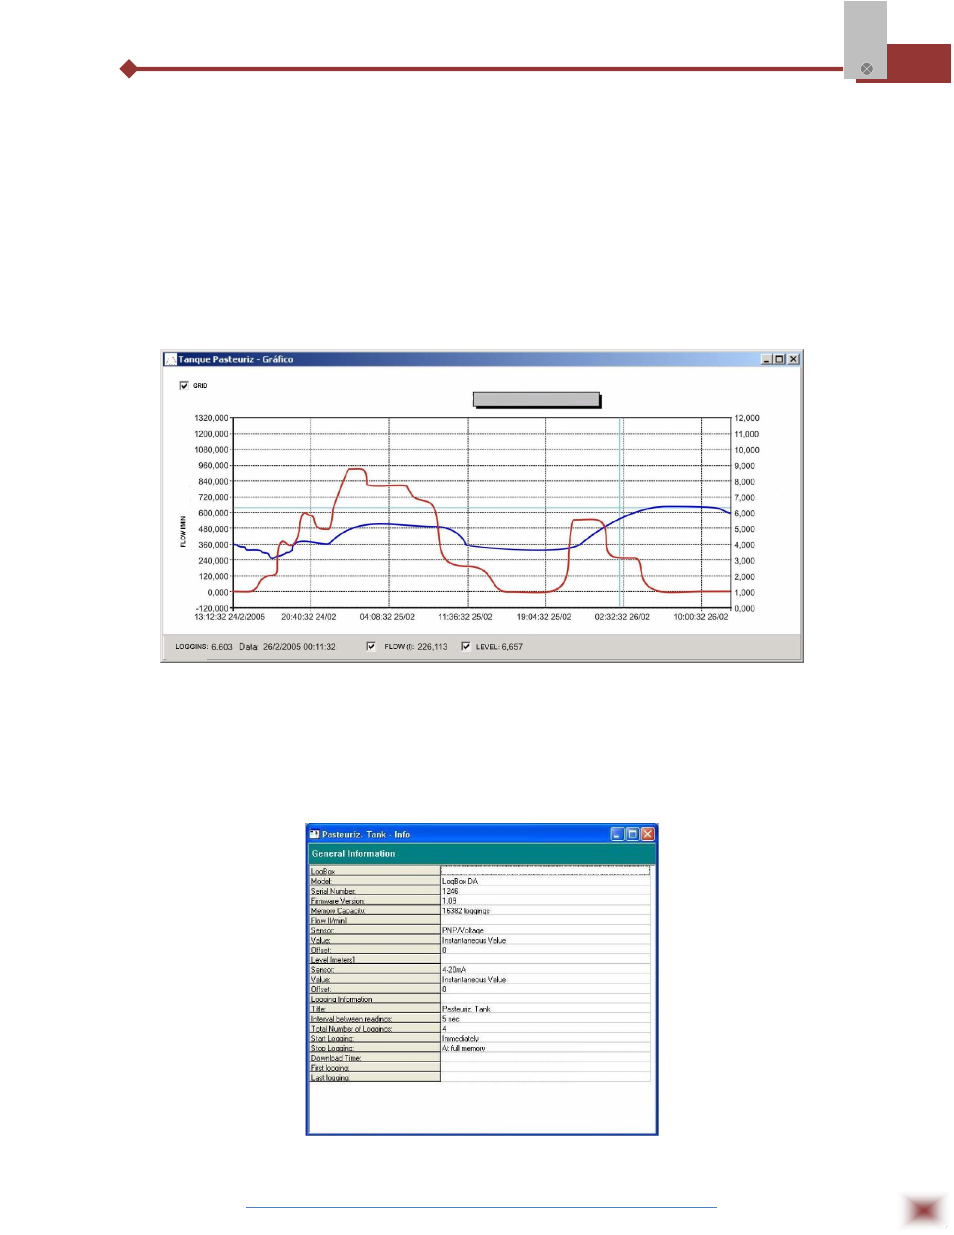
7.1.1 GRAPH WINDOW
The Graph is a convenient tool for analysis. It enables the logger acquisitions to be read in the
form of a “values x time” graph. As one moves the mouse in the chart area, the time and the value of
the records of each channel are shown in the field located in the bottom of the window.
Zooming in and out are implemented. It is possible to select an area by clicking and dragging
the mouse, thus creating a zoom region, starting at the upper left position of the region of interest.
Graph window.
NOTE: The command Offload acquisitions does not interrupt the process of data logging and reading.
Other two windows can be easily opened: General information window and Tables window.
7.1.2 GENERAL INFORMATION TABLE
Displays information about the logger that registered data: its features and configurations, and
details about data acquired.
General Information window