Introduction – Casella CEL CEL-281 User Manual
Page 32
Advertising
10%
20%
30%
40%
50%
60%
70%
80%
90%
100%
10%
5%
Probability%
Cumulative%
L
90
L
50
L
10
dB
L
L
MAX
MIN
dB
910006
100
65%
70
80
90
110
120
130
140
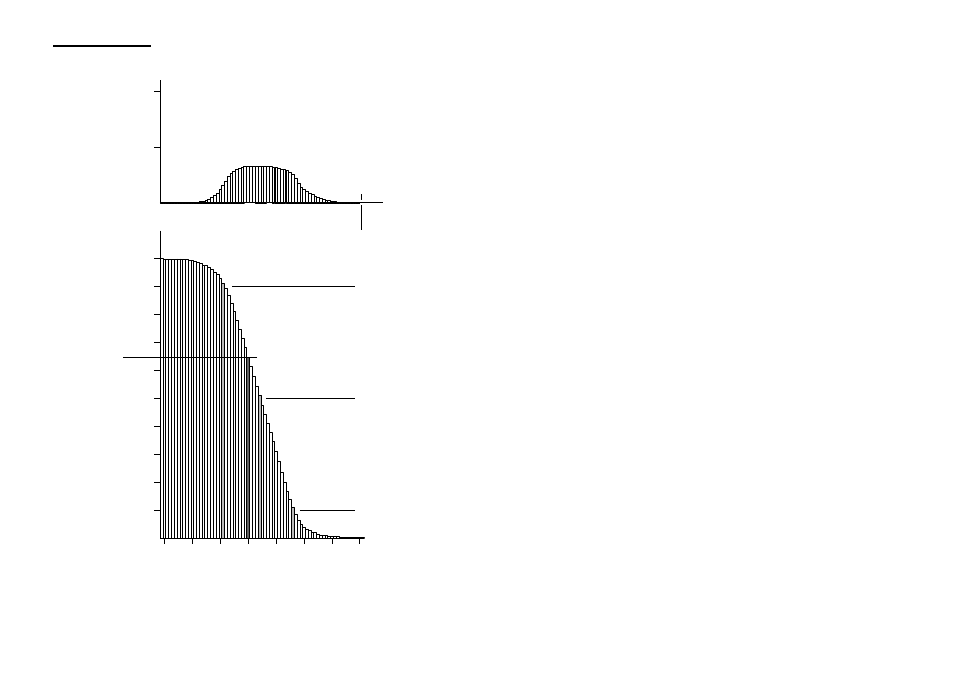
Figure 3 Comparison of probability% and cumulative% histograms
(Note the different vertical scales)
Page 24 - CEL-281 Operator's Handbook
Introduction_
Advertising
See also other documents in the category Casella CEL Measuring instruments:
- CEL-62X (37 pages)
- CEL-63X (87 pages)
- CEL-430 (8 pages)
- CEL-440 (70 pages)
- CEL-480 (2 pages)
- CEL-231 (2 pages)
- CEL-283 (6 pages)
- CEL-228 (6 pages)
- CEL-275 (56 pages)
- CEL-393 (99 pages)
- CEL-193 (20 pages)
- CEL-224 (4 pages)
- Vortex personal sampling pumps (14 pages)
- Vortex Ultraflow area sampling pump (12 pages)
- Tuff personal sampling pumps (38 pages)
- Tuff personal sampling pump (1 page)
- Environmental enclosure for Microdust (10 pages)
- Sampling heads for personal dust sampling (24 pages)
- Apex personal sampling pumps (40 pages)
- Apex personal sampling pump (2 pages)
- CEL-630 (2 pages)
- AFC123 (24 pages)
- Airborne bacteria sampler (16 pages)
- CEL-620 (2 pages)
- CEL-500 (16 pages)
- CEL-400 (2 pages)
- CEL-450 (77 pages)
- CEL-272 (8 pages)
- CEL-420 (16 pages)
- CEL-320 (24 pages)
- CEL-300 (2 pages)
- CEL-268 (99 pages)
- CEL-350 (2 pages)
- CEL-35X dBadge (48 pages)
- CEL-315 (45 pages)
- CEL-180 (14 pages)
- Thermohygrograph standard model (12 pages)
- Tipping bucket rain gauge (16 pages)
- Thermohygrograph deluxe model (12 pages)
- Piche evaporimeter (4 pages)
- Nomad portable weather system (2 pages)
- Fortin barometer (11 pages)
- Campbell Stokes Sunshine recorder (2 pages)
- Barographs small and display pattern (2 pages)