Casella CEL Software for Heat Stress Monitor HSM100 User Manual
Page 9
HEAT STRESS MONITOR
Handbook No. HB3215-05
Page 9 of 16
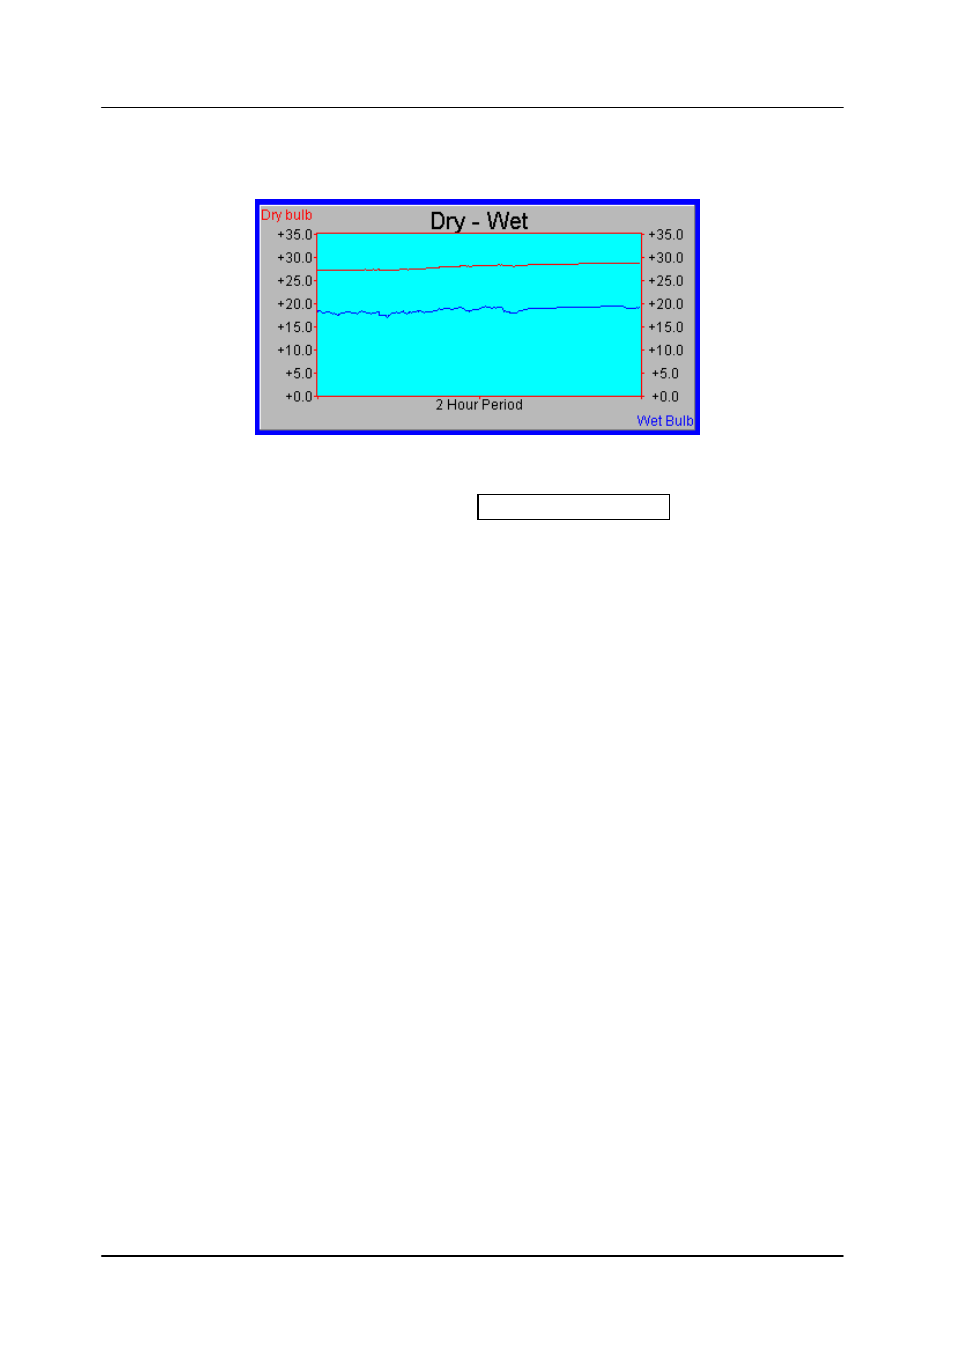
12.6 Graph box
Provides a real time scrolling graph for one or two traces over a user selectable time period.
The trace dimensions box contains values to set up the position and size of the trace area in
relation to the outer box.
TRACE DIMENSIONS
In this example, the trace area starts 35 pixels to the right of the top left hand corner of the
element window and 40 pixels down. The trace area is 400 pixels wide and 360 high.
13.0 SCROLLING DISPLAY FEATURE
The Heat Stress software provides up to 8 separate display pages. Each page may be selected for display
from the 'View' pull down menu.
The 'Scroll' option allows the software to automatically display the pages in any sequence with a
programmable delay between each page.
To enable the scroll mode, select 'Scroll setup' from the 'Options' pull down menu. Click on the Enable
box to enable or disable the automatic scrolling and enter the sequence in which you want the pages to
appear in the 'Order' box.
The default time delay is fifteen seconds, however this can be changed by editing the [Scroll] section of
the HSM.INI file.
[Scroll]
Enable=Yes
Order=1,2,3,4,
Interval=15
This will give a time delay of 15 seconds. Note that the scroll mode enable/disable and page order may
also be changed here.
35,40,400,360