Ivie IE-45 RT60 - Reverberation Time Analysis User Manual
Page 6
IE-35 & IE-45 RT-60 Manual
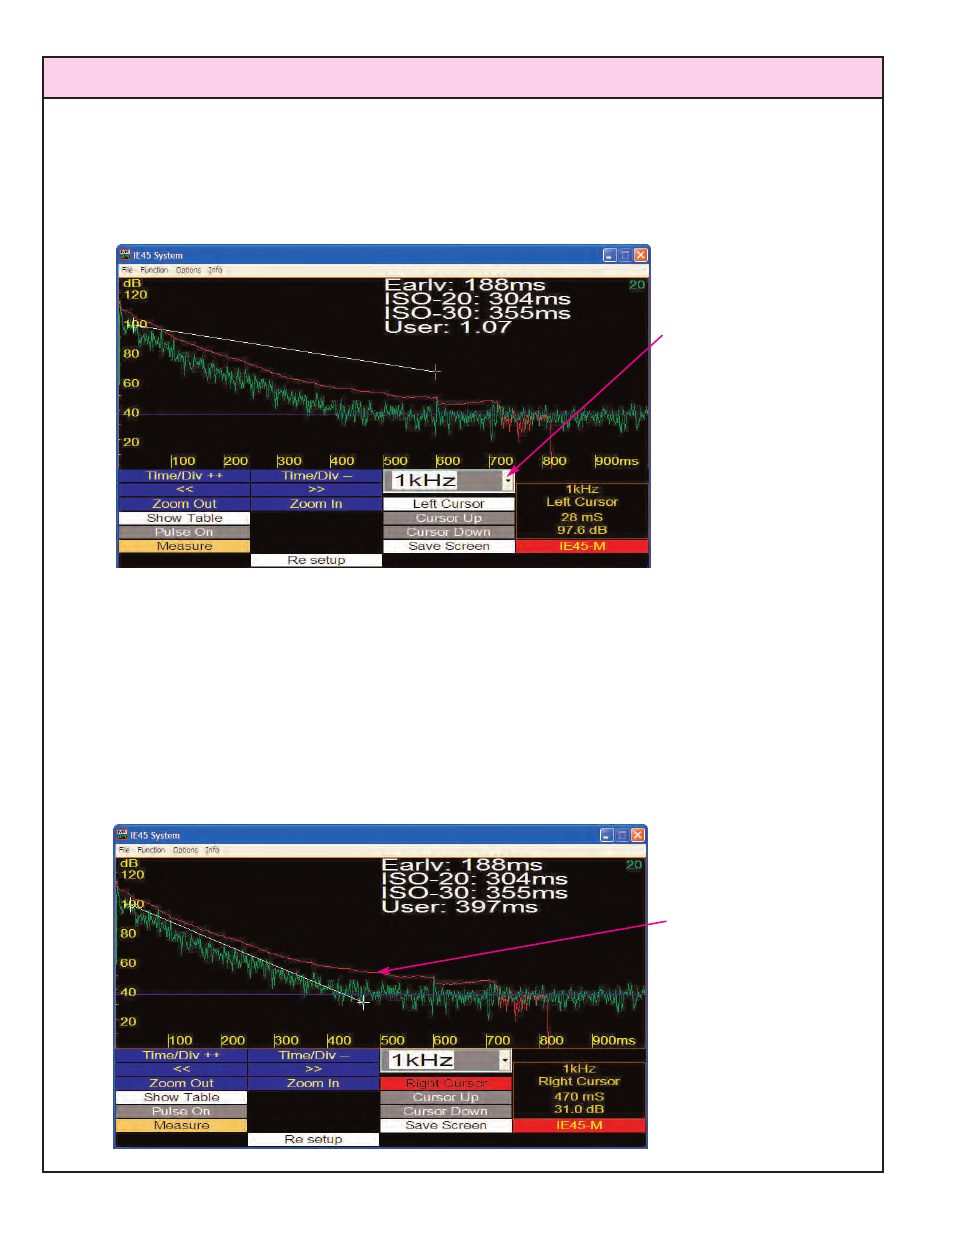
Note: In the example RT60 curve display below, the frequency is 1000 Hz (1kHz). This is
the default frequency display channel, whether octave or 1/3 octave measurements have
been made. To view, or manipulate a different channel, use the stylus arrow next to the fre-
quency readout window to select the channel desired.
To select a portion of the decay curve for a “User Defined” RT60 calculation, tap the decay
curve at the upper section (or, if you prefer, you can instead use the Schroeder curve, which
is the decay curve with a smoothing algorithm applied) with the stylus to place the left cursor.
If your stylus misses the curve a little, use the “Cursor Up,” or “Cursor Down” stylus buttons to
place the left cursor exactly on the decay curve.
Next, tap the cursor button labeled “Left Cursor.” It will change colors and be relabeled “Right
Cursor.” Tap the lower section of the decay curve with your stylus to position the right cursor
on the decay curve. Again, if you “miss” a bit, you can use the “Cursor Up,” or “Cursor Down”
stylus buttons to fine tune the right cursor so it is exactly on the decay curve.
page 6
Note: The Schroeder
curve is the decay
curve with a smoothing
algorithm applied. The
left and right cursors
can be placed on it,
instead of the decay
curve, to calculate
RT60, if desired.
Note: Tapping here
pops up a window
which allows you to
select for viewing the
decay curve for any
octave, or 1/3 octave
channel. The default
display channel is 1
kHz.