0 filter shape and interaction effects – BSS Audio FCS-960 Owner's Manual User Manual
Page 15
15
Filter Shape and Interaction Effects
Graphic equalisers have tremendous value in their ability to modify
the amplitude response of a sound system. They have become the
most widely used type of equaliser product for the general sweetening
of a sound system, as well as for more precise work in helping to
remove unwanted resonances in a reverberant room or removing
feedback in stage monitoring systems. Their advantages lie with the
visual picture obtained by the fader positions in representing the
modifications made to the frequency response, and with the recipro-
cal nature of the boost and cut effect. Their disadvantages lie in hav-
ing only certain fixed frequencies available, and with the interaction
effect of one fader on its adjacent fader. The pictorial view of a modi-
fied amplitude response as shown by the fader positions is an ‘ideal-
ised’ one. Each filter has a predetermined shape, defined by its Q
value and design topology and the actual result obtained will not
necessarily be a smooth curve, as depicted by the fader knob posi-
tions, but rather one which is defined by the overall shape of each
filter and how it combines with its adjacent filter. For the application
of general sweetening where groups of faders will be moved to form a
particular shape, a good combining effect is desired to avoid a
number of humps appearing in the amplitude response. This requires a
particular filter design which is not compatible with that needed when
greater selectivity is required for room tuning and feedback suppres-
sion. Moreover, on some graphic equaliser designs, the Q value will
vary as the amount of boost or cut is varied, further adding to the
complication.
On the FCS-930/960 we have carefully optimised the design to ac-
count for these effects. Adding the dual mode feature allows us to re
configure the filter shapes to accommodate the different applications.
Using a constant Q filter design removes the width variation with
boost and cut, thus allowing more selectivity at low levels of boost
and cut.
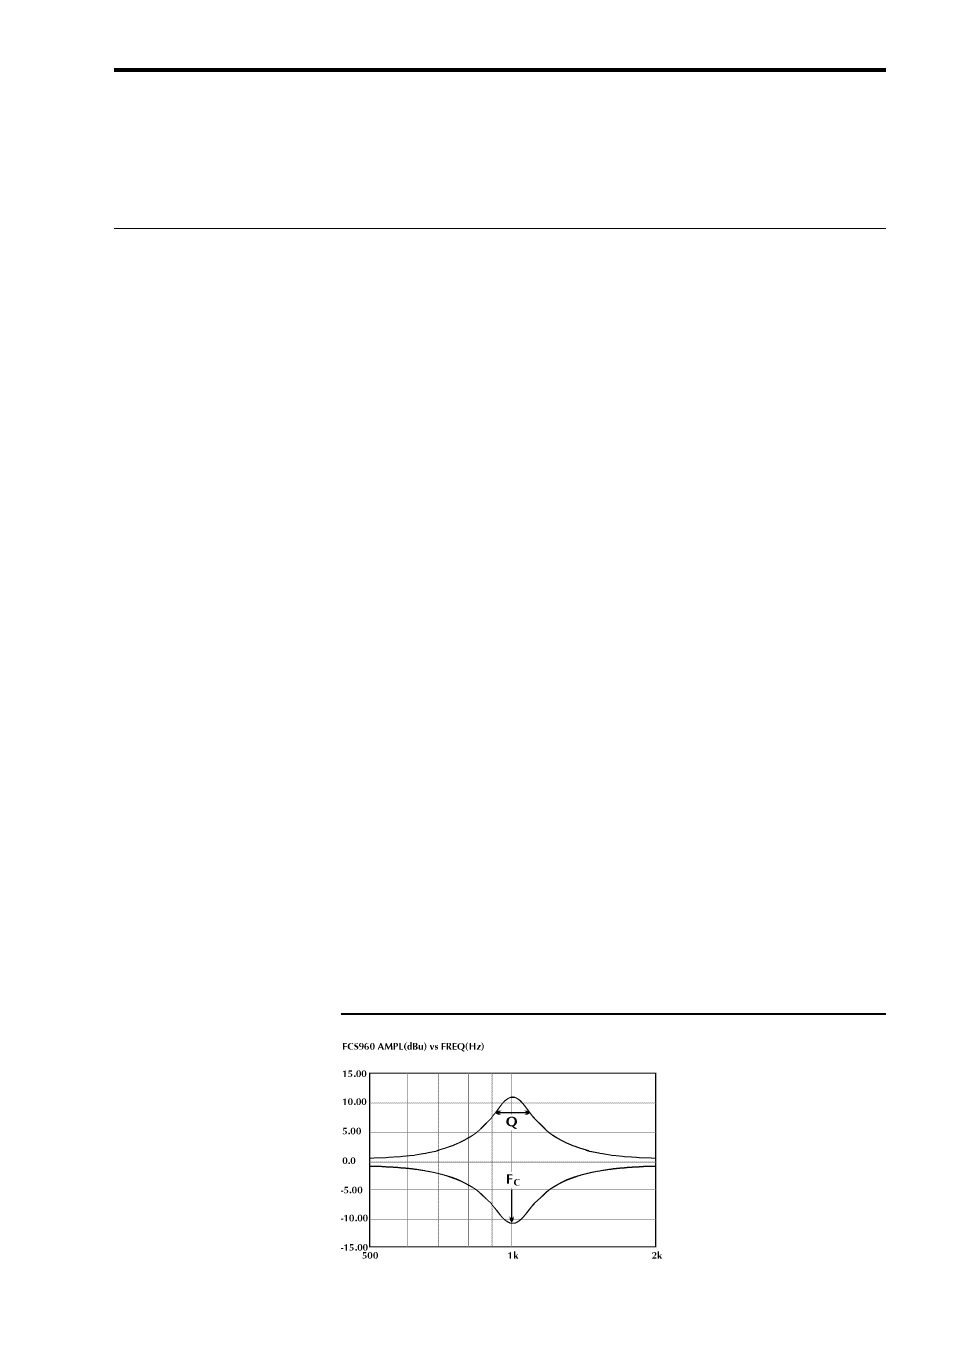
The basic amplitude shape of each filter is shown in Fig 6. The fre-
quency is that at the centre of the response, the Q value is a measure-
7.0
Filter Shape and Interaction Effects
Fig. 6 Frequency
Response of Filter
Frequency is fc.
Q value is a measure of the
width of the peak, 3dB
down from the peak
amplitude value.