Available widgets adding widgets – Faronics Power Save Dashboard User Manual
Page 14
Faronics Power Save Dashboard
14
|
Faronics Power Save Dashboard
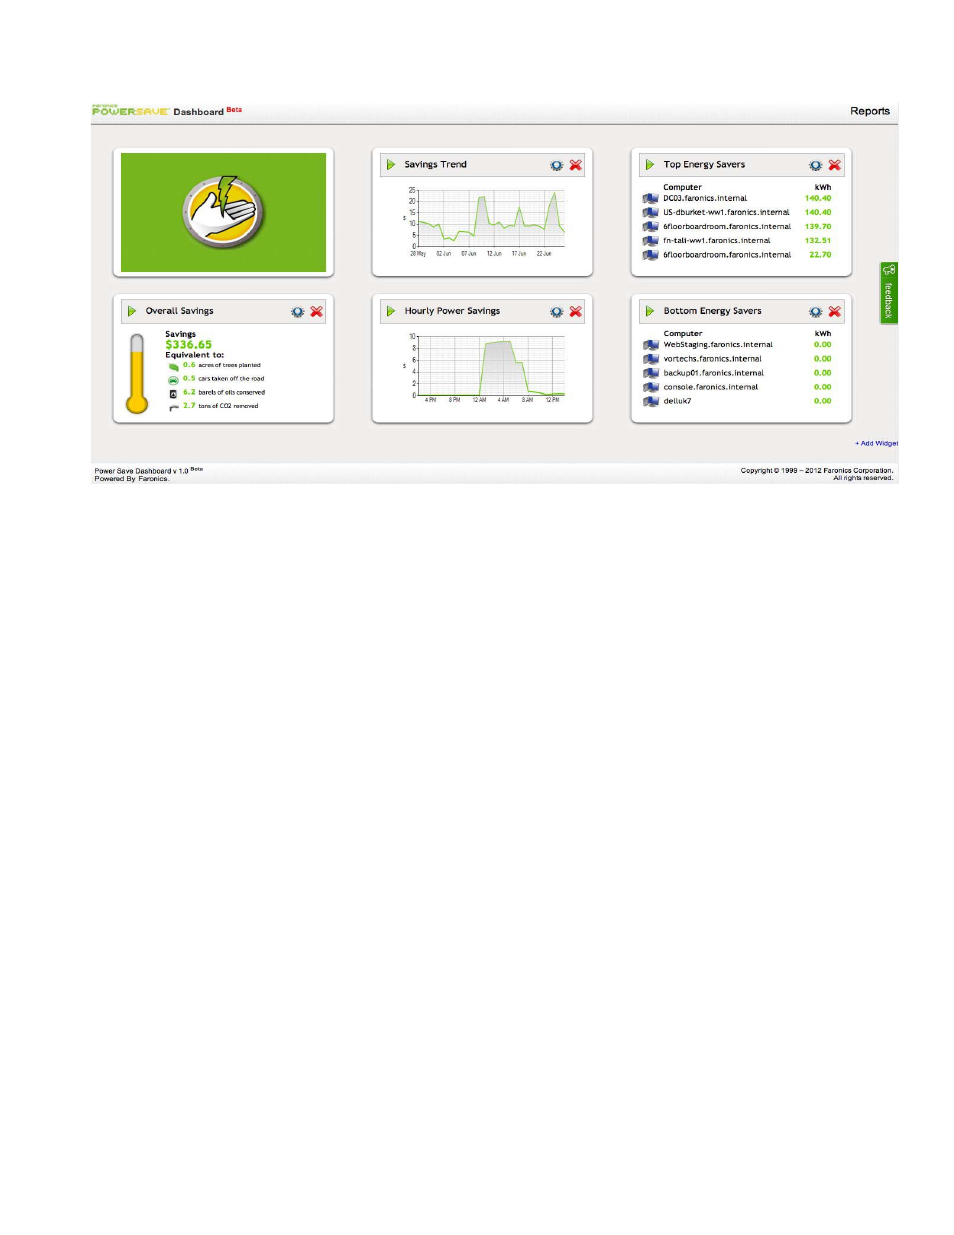
The Faronics Power Save Dashboard is displayed as follows:
Available Widgets
The following widgets are available on the Power Save Dashboard by default:
•
Hourly Power Savings — displays the power saved ($) by all computers each hour. You can
monitor the hourly power savings by all computers across the network. You can determine
hours when maximum power is saved and the hours when very little power is saved. This
helps understand the energy consumption patterns on the network.
•
Savings Trend — displays the trend of power saved ($). You can monitor the increase or
decrease in power saved over time. You can take corrective action on viewing a reducing
savings trend. This helps in creating goals for power savings.
•
Overall Savings — displays the total power saved ($) till date. This helps keep track of current
power savings.
•
Top Energy Savers — displays the top energy savers (computer names). You can determine the
computers that save maximum power. You can identify computers that are rarely used or
abandoned. This helps understand user behavior on the computers.
•
Bottom Energy Savers — displays the bottom energy savers (computer names). You can
determine the computers that save minimum power. You can take corrective action on the
computers that are listed as bottom energy savers. This helps identify users who are attentive
to power consumption minimization or computers that are highly utilized.
Adding Widgets
Power Save Dashboard has multiple widgets. Complete the following steps to add a widget:
1. Click the Add Widgets link. The Add Widget dialog is displayed.