GBS Elektronik MCA166-USB Behavior at different Temperatures User Manual
Page 2
channels above half maximum are used, which represent 76% of the total peak area. This yields in a statistical
centroid error depending on peak area N of
∆
E
FWHM
N
≅
×
0 5
.
(2).
systematic error: From the definition above, it can be derived that the centroid is not a linear function of the
photon energy, but has some discontinuities. This discontinuities occur, when a channel at the edge has about half
of the maximum counts and it is decided whether to include it into the centroid calculation or not. The difference
when including another channel is
∆
n
is
s
m s
is
s
s
i
i
m
i
m
i
=
−
⋅ +
+
∑
∑
∑
∑
.
The edge channel m is about 0.5*FWHM from the centroid:
is
s
m
FWHM
i
i
∑
∑
− =
⋅
0 5
.
,
the gaussian distribution s of the peak is
(
)
(
)
s
area
e
area
FWHM
e
i
i n
i n
FWHM
=
=
⋅
−
−
σ π
π
σ
2
8
2
2
0
2
2
0
2
2
2
8
2
2
ln
* ln
,
the sum of the channels above FWHM is
s
area
i
∑
=
⋅
0 76
.
, the content of the edge channel is just half of the
maximum channel
s
area
FWHM
m
=
⋅
⋅
1
2
8
2
2
ln
π
and the ratio is
s
s
FWHM
FWHM
m
i
∑
=
⋅
⋅
=
2
2
0 76
2
0 618
ln
.
.
π
.
Assuming now that the FWHM (in channels) is large (>4), the difference can be estimated as
∆
n
FWHM
s
s
s
s
FWHM
FWHM
m
i
m
i
=
⋅
⋅
+
≅
⋅
⋅
=
∑
∑
0 5
1
0 5
0 618
0 309
.
.
.
.
(3)
So almost independent from FWHM, this centroid calculation algorithm causes discontinuities of about 0.3
channels, which can be seen as an systematic error of +/- 0.15channels. As this discontinuities are caused both by
channels on the left and the right side of the peak, it is better to multiply this value with
2
which results in an
error of +/- 0.21 channels to be assumed.
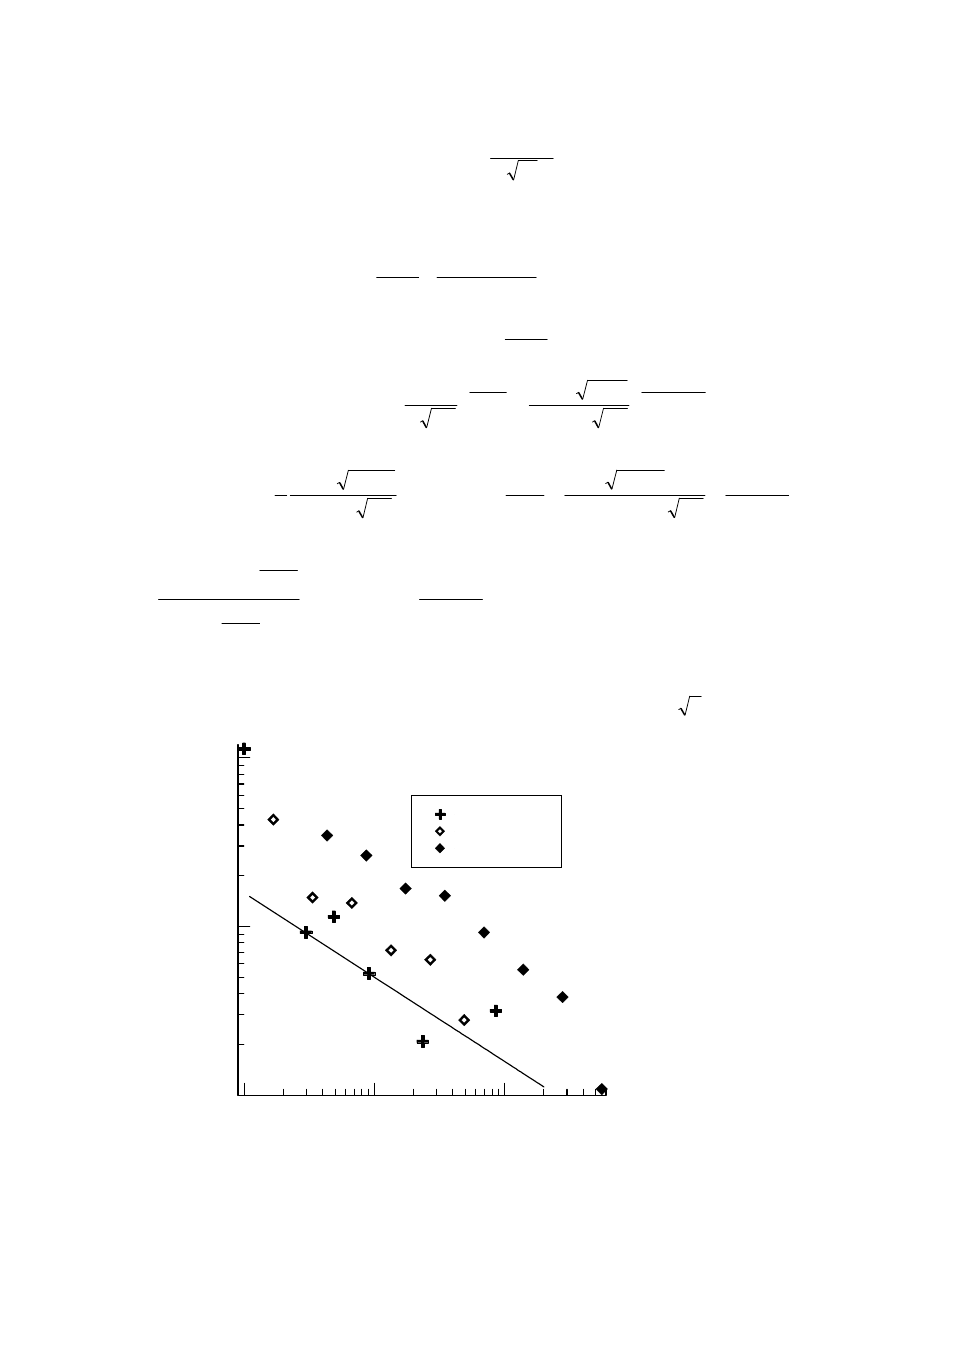
10
100
1000
P e a k a re a
0.01
0.1
1
C
e
n
tr
o
id
e
rr
o
r
(i
n
F
W
H
M
u
n
it
s
)
3 51 .99
6 0 9 .1 4
35 1 .9 6
6 0 9.2 3
3 5 2.0 7
11 1 8 .3
F W H M 3 ch a n n els
F W H M 1 1 .5 c h an n e ls
F W H M 4 6 ch a n n e ls
Fig. 1. Centroid error dependend on peak area using peaks which are large compared to background. If the
FWHM is only a few channels, the formula derived for statistical centroid error can be applied. If FWHM is too
large, then the centroid error is increased due to strong fluctuations of the channels used for evaluation.
In an experimental study of the centroid error it was found that there is a third contribution to the centroid error if
the peak area is distributed to many channels. In this case, the statistics of a single channel content is very bad.