Ez-analyst – Measurement Computing ZonicBook 618E rev.3.4 User Manual
Page 26
eZ-Analyst
Real-Time Vibration & Acoustic Analysis Software
Features
• Real-time FFT analysis
• Easy-to-use graphical user interface
• Field expandable from 8, up to 56 channels
• Four tachometer channels
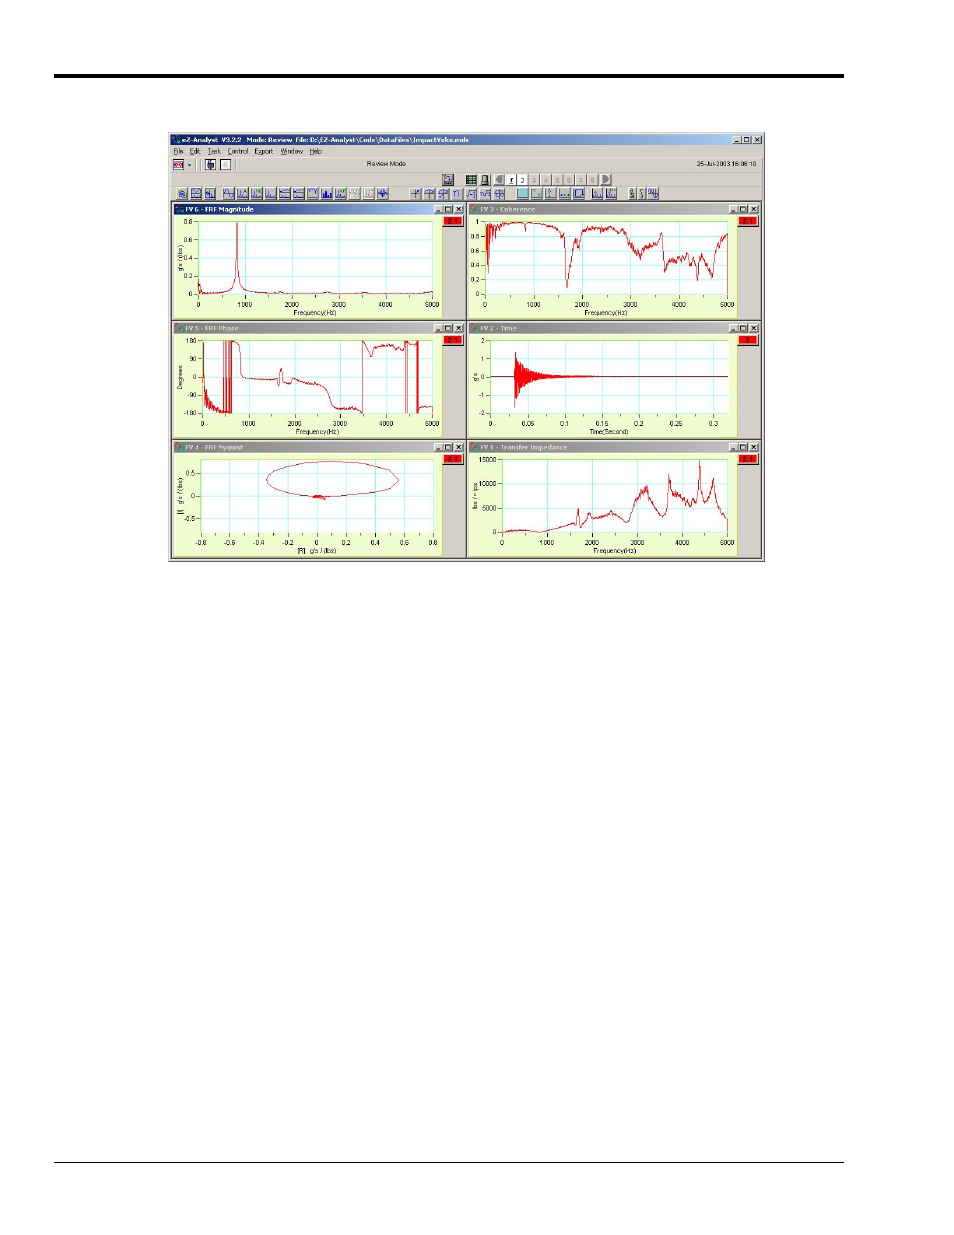
• View all functions simultaneously in eight display windows,
with up to 16 data overlays in each window
• Export your data to Excel, ME Scope, SMS Star, or UFF Type 58 ASCII or Binary
• Wide selection of real-time analysis features, including integration/differentiation
synchronous averaging, and much more
eZ-Analyst is a graphical analysis application you can use to collect, analyze, record, and playback
recorded data. When used with ZonicBook or WaveBook hardware, eZ-Analyst can collect and display
multiple channels of data in real-time. The graphical displays can consist not only of the raw time-domain
data, but also plots of frequency domain data. For example, real time FFT (Fast Fourier Transform) plots.
Data that is recorded to disk-file is in the raw time domain and can be played back for additional analysis
time and time again. For example, a raw signal can be played back over-and-over using different filtering
algorithms to manipulate the signal.
Configuration
eZ-Analyst features a familiar Windows-style graphical user interface, making it easy to configure the
hardware with simple fill-in-the-blank type configuration screens. Selectable hardware parameters include,
but are not limited to: channel selection, channel type (either response or reference), range, auto-ranging,
and triggering. Configurations can be saved and recalled for future use, making it simple to change from
one test to another.
4-2 A Brief Look at Software
929895
ZonicBook/618E