Postview toolbar items – Measurement Computing TempBook rev.3.0 User Manual
Page 26
4-2 Using PostView (16-bit)
11-16-00
TempBook User’s Manual
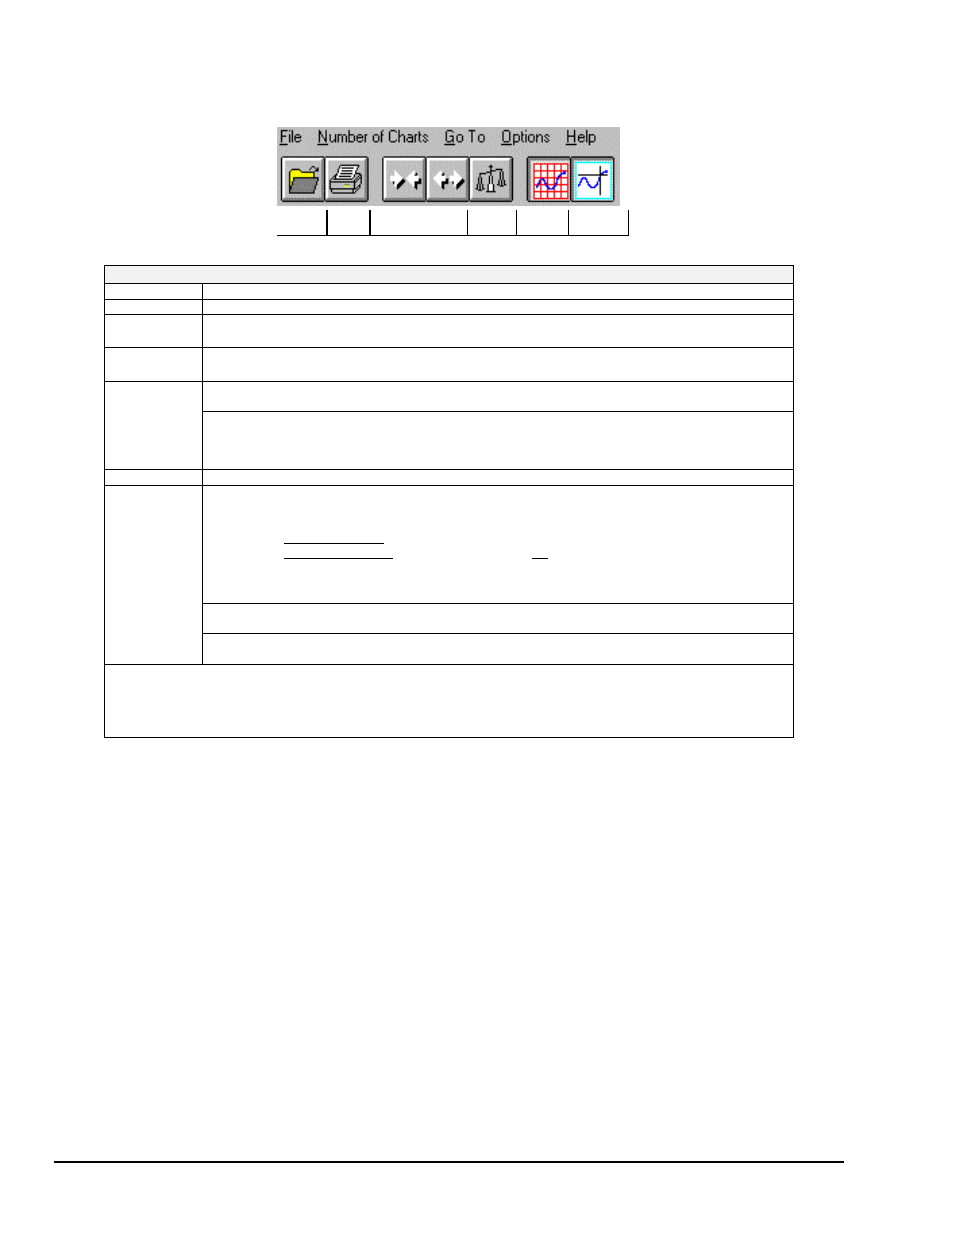
PostView Toolbar Items
Open
Zoom Out ><
Zoom In <>
Auto-
Scale
Show
Grid
Show
Markers
PostView Toolbar Items
Open
Accesses the Open Data File window.
Sends the PostView chart(s) to an assigned printer.
Zoom Out
(
><
)
The Zoom Out button doubles the visible timebase, showing more of the waveform. For example, if 10
seconds of information is visible, clicking the Zoom Out button will show 20 seconds.
Zoom In
(
<>
)
The Zoom In button halves the visible timebase, showing less of the waveform. For example, if 10
seconds of information is visible, clicking the Zoom In button will show 5 seconds.
Autoscale
Clicking the Auto Scale button adjusts the Y-axis labels so that the visible waveform fills 90% of the
chart’s range.
Y-axis Adjust
The Y-axis Adjust fields show the chart’s minimum and maximum for visible charts in the engineering
units shown. Clicking the Auto Scale button automatically adjusts the Y-axis Adjust fields. To adjust
any chart’s minimum or maximum, place the cursor in the desired Y-axis Adjust field, and type in a
new value.
Show Grid
Places a grid on the chart (s), or removes the grid if already present.
Show Markers
Each chart contains a cross-hair marker that shows the numerical values of time and magnitude at its
present location in the waveform. The Markers start out at the far left of every chart, showing the
time and magnitude of the first visible point.
•
Left mouse button allows the user to drag the marker of each chart independently.
•
Right mouse button moves the markers from all the charts in unison.
The Options menu contains a function which allows you to turn markers on and off. When a check
appears in front of this item, its associated indicator is on or visible. Selecting the menu item toggles
the indicator (and the check mark) on and off.
Trigger Event
Marker
The Trigger Event Marker on the time axis shows the location of the trigger point.
Stop Event
Marker
The Stop Event Marker on the time axis shows the location of the stop point.
The Scroll Bar at the bottom of the PostView window (see figure on previous page) allows the waveforms to be scrolled
right or left in two ways:
1.
When clicked on, the small left and right arrow boxes scroll the waveforms approximately 20%.
2.
The plain scroll button shows the relative location of the visible region of the waveforms and can be
dragged along the scroll bar to any location desired.