Super Systems AC20 User Manual
Page 58
56
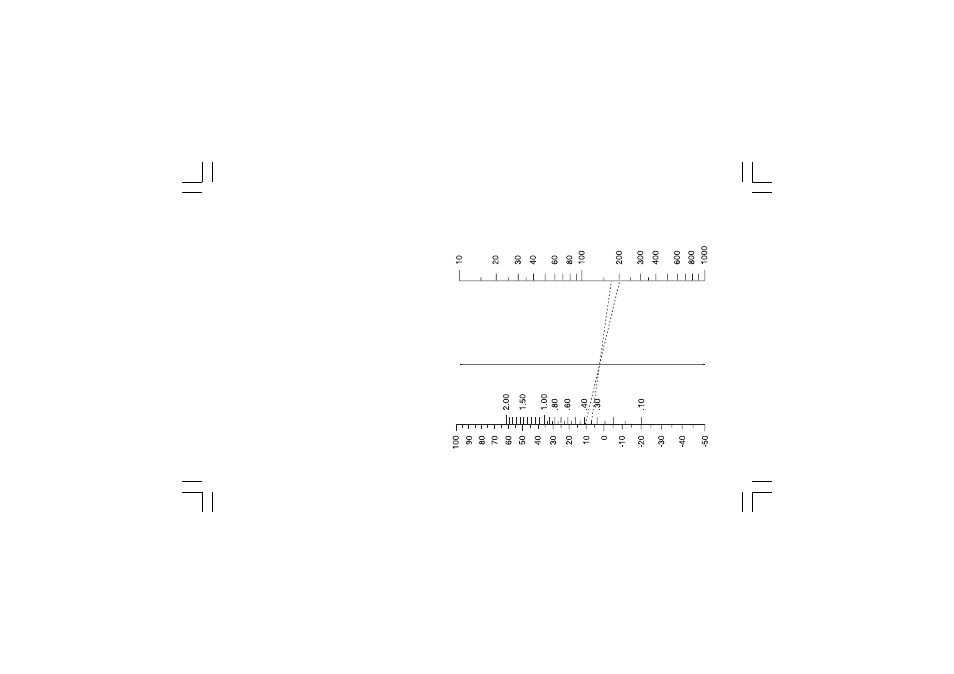
COF AND H2F ADJUSTMENT DIAGRAM
COF AND H2F ADJUSTMENT DIAGRAM
COF AND H2F ADJUSTMENT DIAGRAM
COF AND H2F ADJUSTMENT DIAGRAM
COF AND H2F ADJUSTMENT DIAGRAM
Others gas present in the atmosphere can
affect the carbon potential or the dew point
measurement.
By this chart it is possible to get the COF or
H2F factors able to correct the variation above
described.
If, for example, the instrument measures 0.4%
of carbon with a COF of 200 and the shim
stock analysis shows an actual carbon value of
0.35%,
draw a line between 0.4% and 200 and mark
the intersection on the pivot line.
Connect 0.35 of % Carbon with that
intersection and extend it till the COF scale (the
new COF value will be approximately 175).
Correct the COF [R.A05] parameter with the
new value.
NOTE:
NOTE:
NOTE:
NOTE:
NOTE: COF is equal to 10 • %CO and
H2F is 10 • %H2.
DEW
POINT
% CARBON
PIVOT
COF or H2F
Nominal H2F
in 40°F endo
Nominal COF
in 40°F endo