H3C Technologies H3C WX3000E Series Wireless Switches User Manual
Page 55
Advertising
46
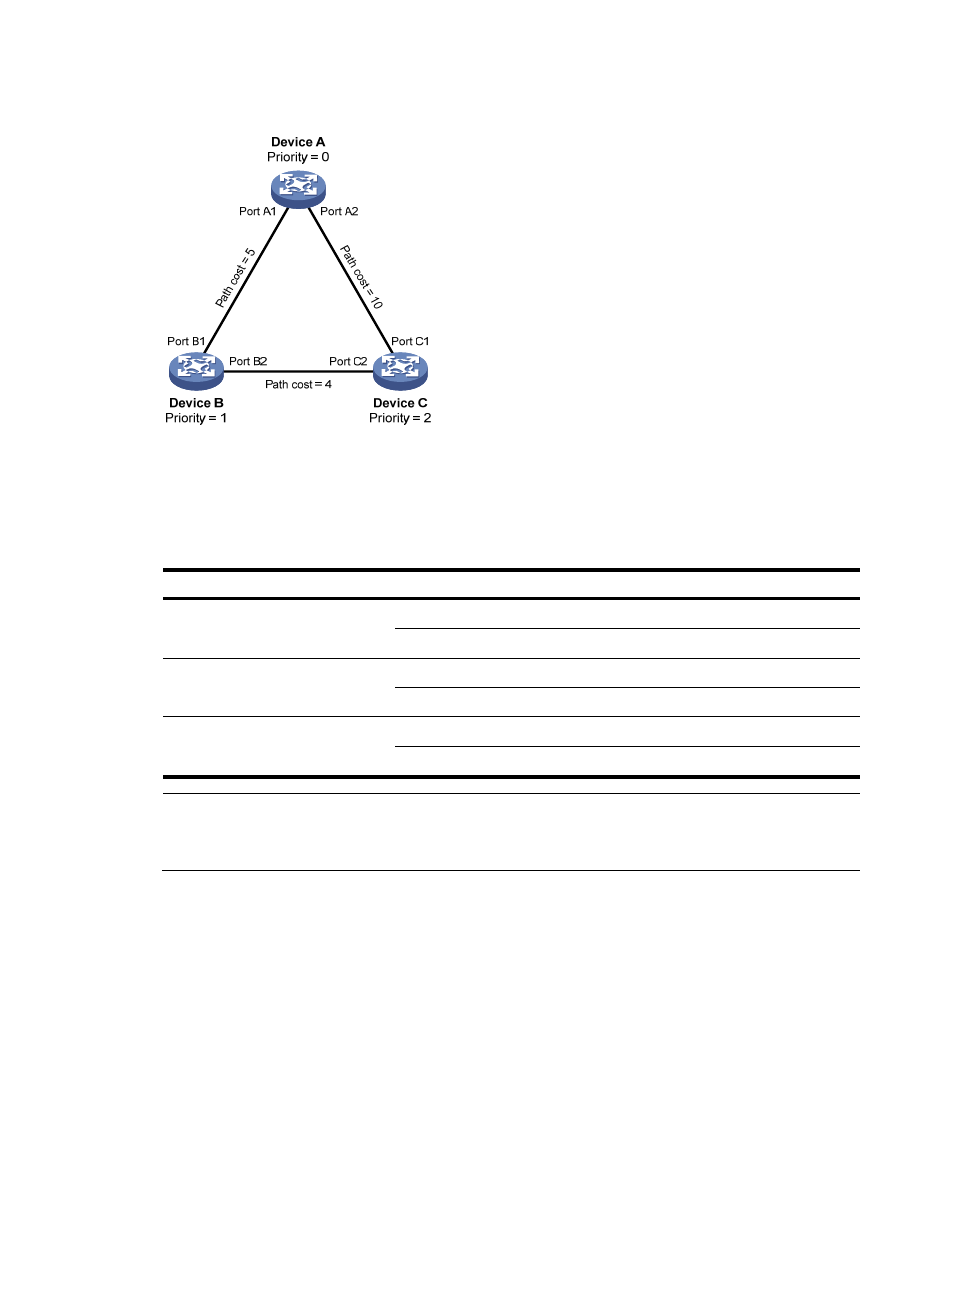
Figure 11 Network diagram for the STP algorithm
As shown in
, the priority values of Device A, Device B, and Device C are 0, 1, and 2, and the
path costs of links among the three devices are 5, 10, and 4 respectively.
4.
Initial state of each device
Table 10 Initial state of each device
Device
Port name
Configuration BPDU on the port
Device A
Port A1
{0, 0, 0, Port A1}
Port A2
{0, 0, 0, Port A2}
Device B
Port B1
{1, 0, 1, Port B1}
Port B2
{1, 0, 1, Port B2}
Device C
Port C1
{2, 0, 2, Port C1}
Port C2
{2, 0, 2, Port C2}
NOTE:
In
, each configuration BPDU contains the following fields: root bridge ID, root path cost,
designated bridge ID, and designated port ID.
5.
Comparison process and result on each device
Advertising