Viewing an all calls report – H3C Technologies H3C Intelligent Management Center User Manual
Page 106
97
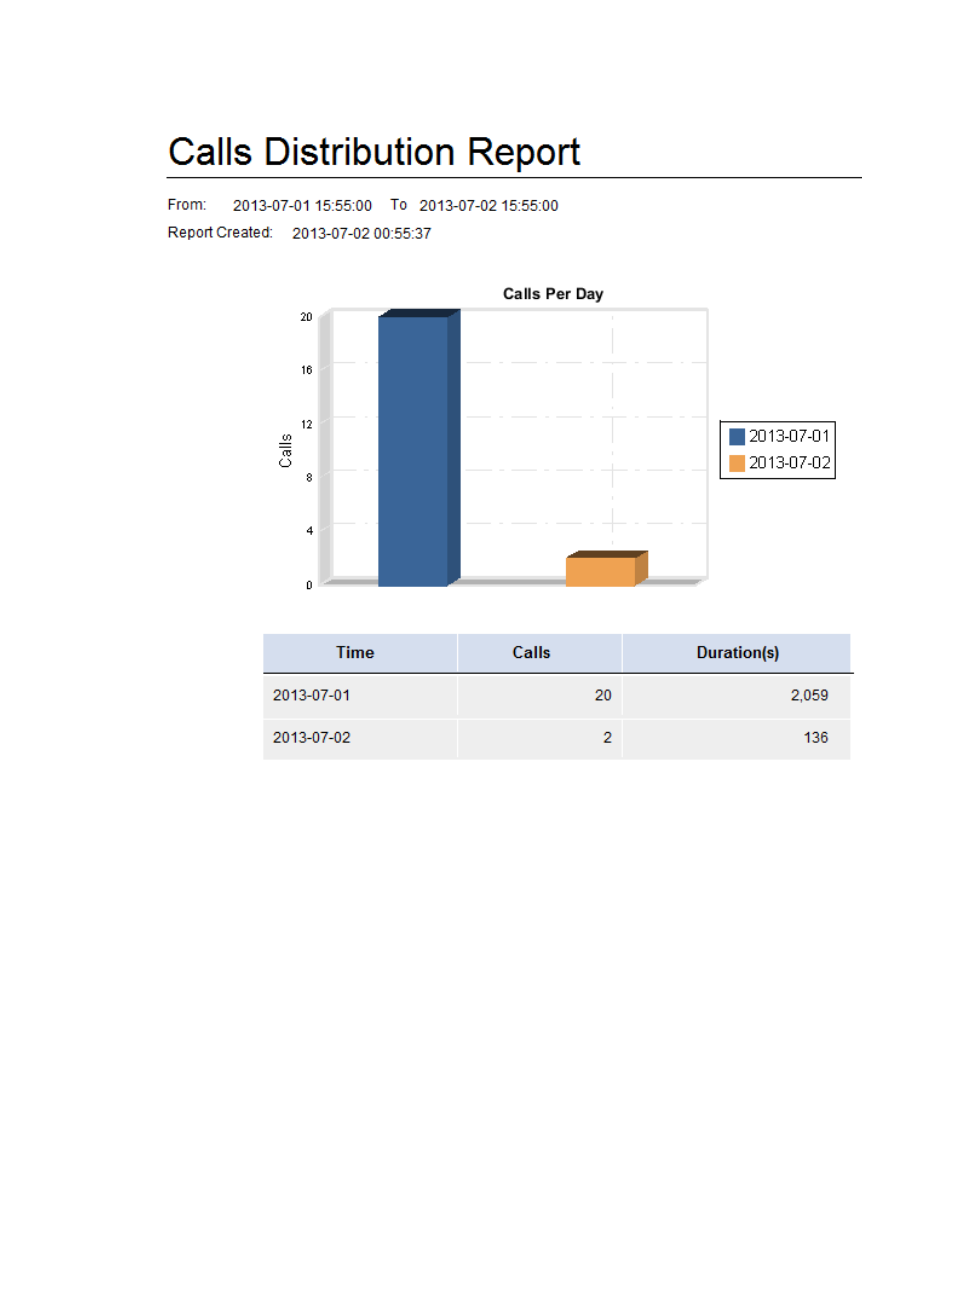
Figure 16 Calls Distribution Report
The following lists the fields on the report that require an explanation:
•
Calls Per Day—This bar chart shows the number of calls on a date basis for the specified time range.
The horizontal axis indicates the dates with different colors, and the vertical axis indicates the
number of calls. If you specify a time range for the same month, the statistics are on a per-day basis.
Otherwise, the statistics are on a per-month basis. The monthly statistics bar chart supports the
drill-down function. Click the bar for a month to display the bar chart with daily statistics for that
month. The chart does not display bars without any call statistics.
•
Time—Date for the statistics.
•
Calls—Number of calls.
•
Duration(s)—Total call duration in seconds.
Viewing an All Calls Report
The All Calls Report shows the top 10 numbers by call count and duration among all phone numbers in
VSM and call information of all phone numbers for the specified time range.
To view an All Calls Report: