Figure 4-1. coordination timing diagram -2 – Basler Electric BE1-50/51B-233 User Manual
Page 32
Advertising
From the time characteristic curve equation.
K
BD
C
M
AD
T
N
Trip
028
0
2
02758
.
0
1
10
2
7624
7
0938
2
.
.
.
028
0
5516
.
0
1
10806
124
5248
15
.
.
.
seconds
0.209
From the reset characteristic curve equation.
1
M
RD
T
2
Reset
seconds
15.5
1
0
2
7.75
2
M = 0 if current goes to zero.
Negative result indicates reset time.
Results:
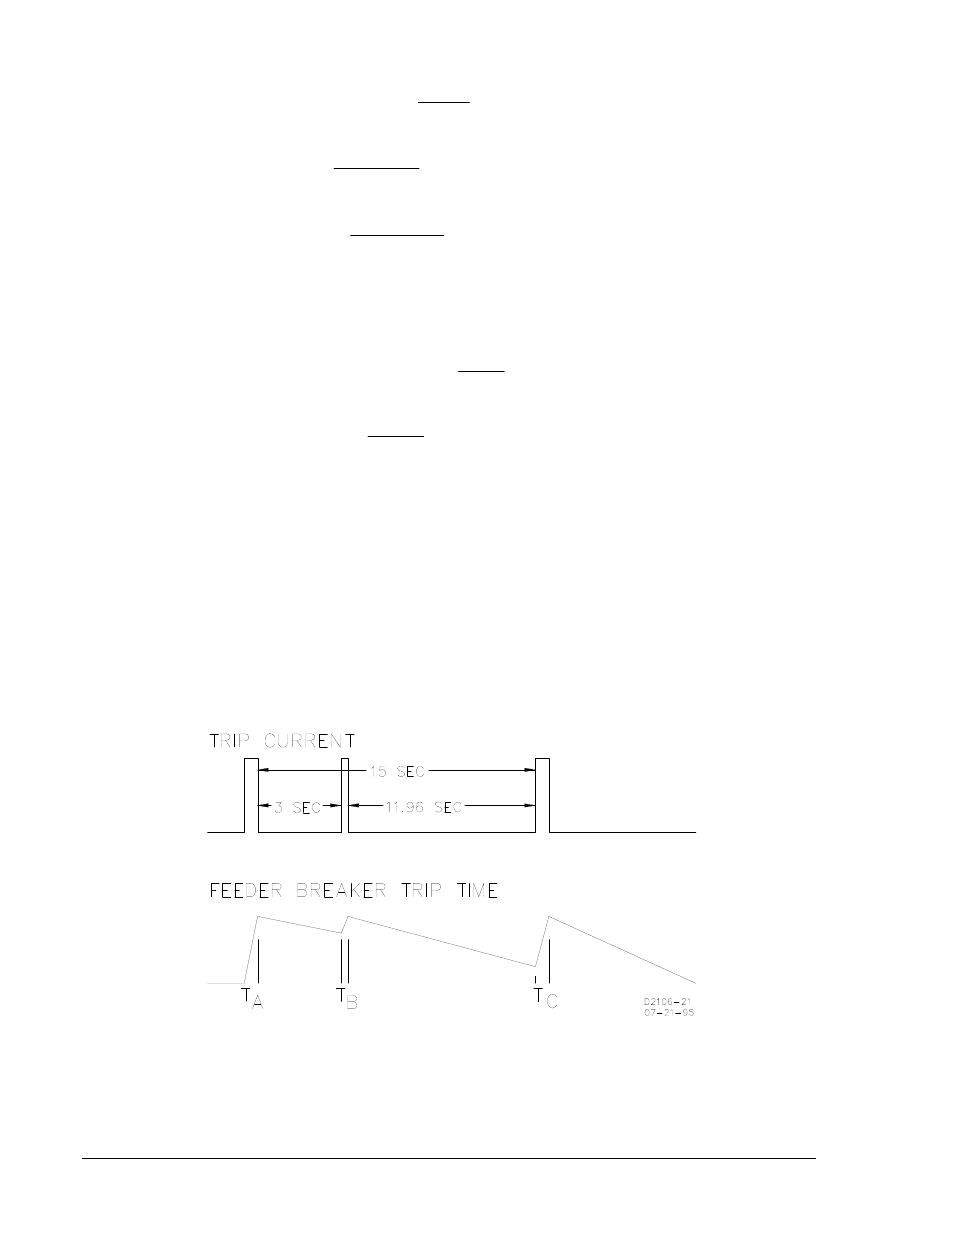
Full trip = 0.209 seconds and full reset = 15.5 seconds if current goes to zero.
In Figure 4-1,
T
A
= 0.209 seconds (relay was at reset).
T
B
= value < T
A
because rewind has not gone to zero.
T
C
= value < T
A
because rewind has not gone to zero.
Figure 4-1. Coordination Timing Diagram
4-2
BE1-50/51B-233 Installation
9252000897 Rev B
Advertising