Interpretation, Weight, Body fat percentage – Beurer BF 66 User Manual
Page 23
23
Interpretation
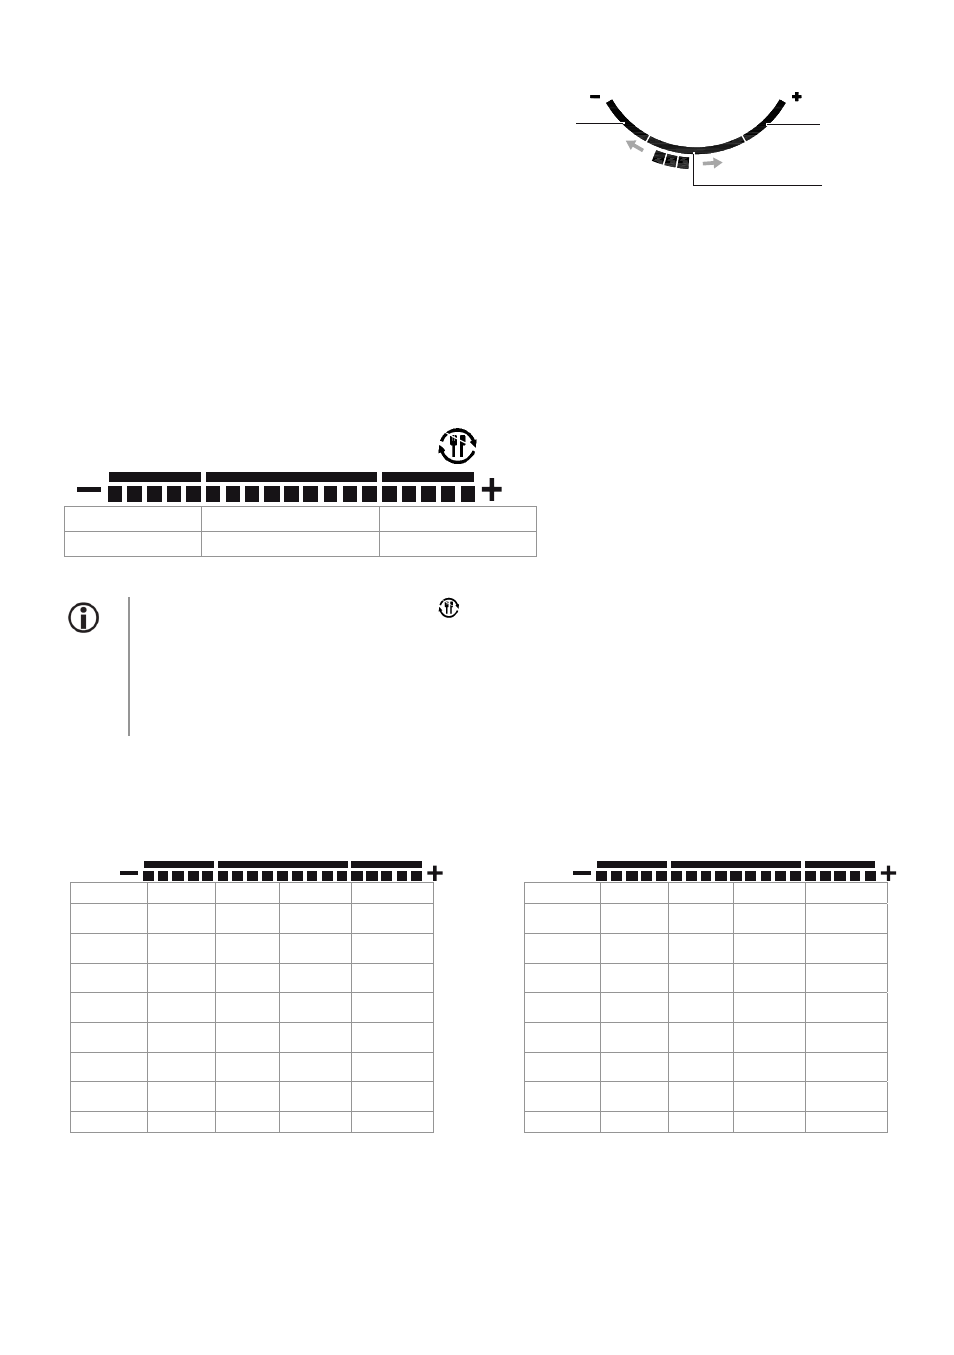
The values for body weight, body fat, body water and
muscle percentage appear in a graphic display, the
bar indicates the interpretation.
• 1 - Values low: Bar positioned on the left (-).
• 2 - Values normal: Bar positioned in the centre (see illustration).
• 3 - Values high: Bar positioned on the right (+).
Weight
Your weight is compared in the BMI (Body Mass Index). The following formula calculates your
weight:
BMI = weight in kg / (body size in m)² .
Underweight Normal
weight
Overweight
< 20
20 - 25
> 25
If your BMI is greater than 25, an
symbol appears next to the interpretation bar.
Tip: Reassess your eating habits and change your diet.
Remember that the BMI interpretation always rates extremely muscular bodies
(such as bodybuilders) as overweight because the BMI formula does not take in-
to account the extremely high muscle mass.
Body fat percentage
The following body fat percentages are guide values (contact your physician for further information).
Man
Age
low
normal
high
very high
10-14
<11
11-16 16.1-21 >21.1
15-19
<12
12-17 17.1-22 >22.1
20-29
<13
13-18 18.1-23 >23.1
30-39
<14
14-19 19.1-24 >24.1
40-49
<15
15-20 20.1-25 >25.1
50-59
<16
16-21 21.1-26 >26.1
60-69
<17
17-22 22.1-27 >27.1
70-100 <18
18-23 23.1-28 >28.1
Woman
Age
low
normal
high
very high
10-14
<16
16-21 21.1-26 >26.1
15-19
<17
17-22 22.1-27 >27.1
20-29
<18
18-23 23.1-28 >28.1
30-39
<19
19-24 24.1-29 >29.1
40-49
<20
20-25 25.1-30 >30.1
50-59
<21
21-26 26.1-31 >31.1
60-69
<22
22-27 27.1-32 >32.1
70-100 <23
23-28 28.1-33 >33.1
A lower value is often found in athletes. Depending on the type of sports, training intensity and
physical constitution, values may result which are below the recommended values stated. It
should, however, be noted that there could be a danger to health in the case of extremely low
values.
2
3
1