Wavetronix Click 500 (programmable controller) (CLK-500) - User Guide User Manual
Page 66
CHAPTER 7 • CLICK 510
65
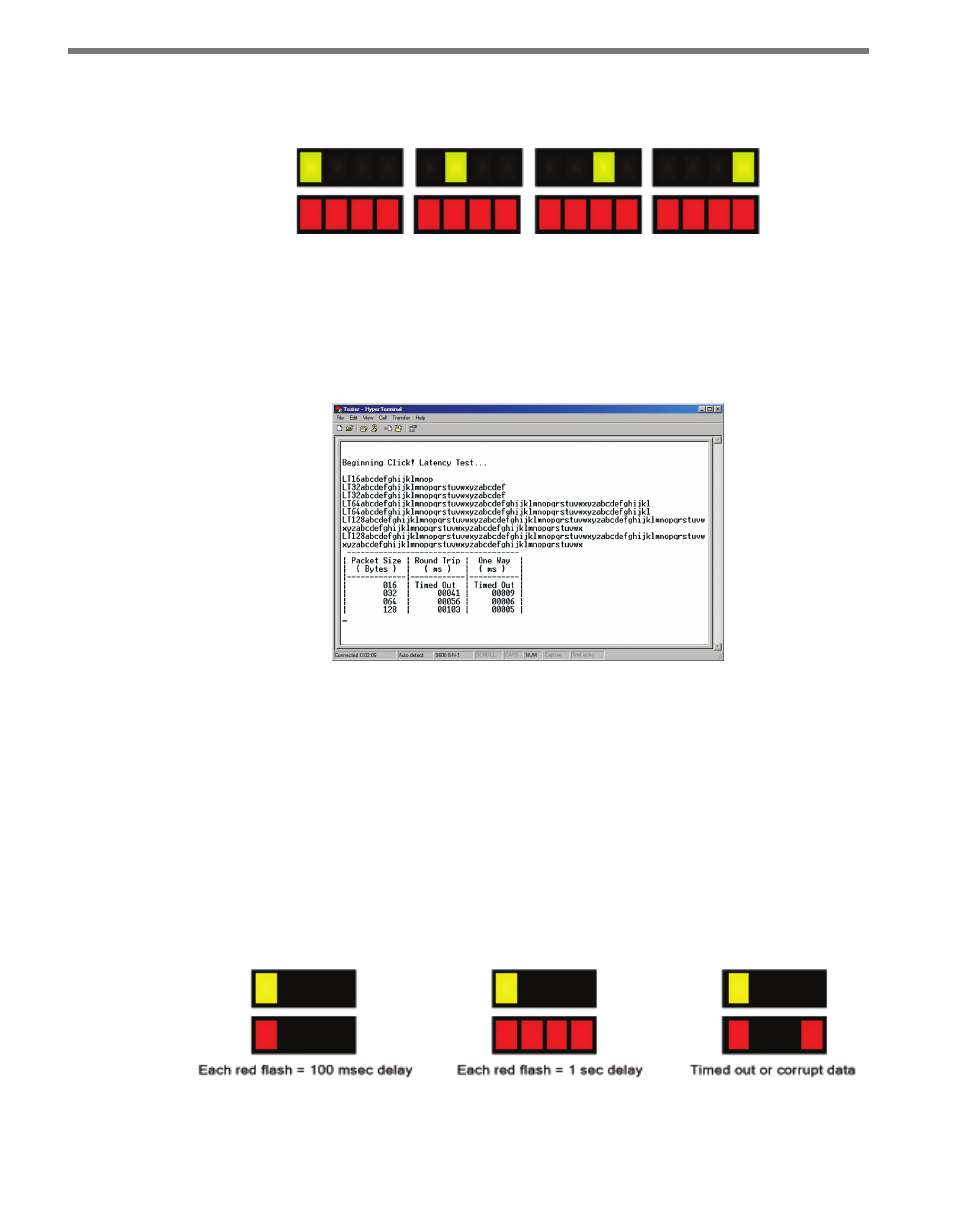
sizes in order and determine the delay time of the communication channel. Figure 7.7 be-
low shows what your submenu LEDs should show during the latency test.
Figure 7.7 – Submenu LEDs during Latency Testing
When latency testing is finished, the results can be viewed in two ways:
˽
For exact delay times, have either of the two devices connected to a computer via a
serial cable before beginning the test. After the test, refer to the tables that come up in
HyperTerminal as shown in Figure 7.8.
Figure 7.8 – Latency Test Results in HyperTerminal
˽
If you are not connected to the computer and want a general idea of the delay time,
you can refer to the submenu LEDs on the device. The device will show results for each
packet size starting with the 16 byte size shown by the first yellow LED. When each
yellow LED illuminates, the corresponding delay time information will be signaled by
the red LEDs.
Figure 7.9 shows what each set of red LED combinations signifies. Each time one red
LED flashes there is 100 milliseconds of delay for that data packet. Each time all red
LEDs flash there is 1 second of delay. Finally, if the two outside LEDs flash this indicates
an error (the device timed out after 5 seconds). The device will display all byte sizes
individually along with the corresponding delay time information.
Figure 7.9 – Latency Test Results on Device