Amprobe IR-750 Infrared-Thermometer User Manual
Page 19
15
Repeat: Tick to display every measurement with the interval you set. Un-tick “Repeat”, the secondary display will
only show measurement results that are different from the last measured temperature. The graph display will
show complete measurement results in the graphics despite whether “Repeat” is ticked or un-ticked.
Sampling Interval allows you to set the sampling intervals of measurement ( 1 to 9999 seconds).
Note: When measurement data reaching to 10000 sets (measurement number), a warning message will pop up
and stop measurements. Save or clear the measurement data before continuing next measurements.
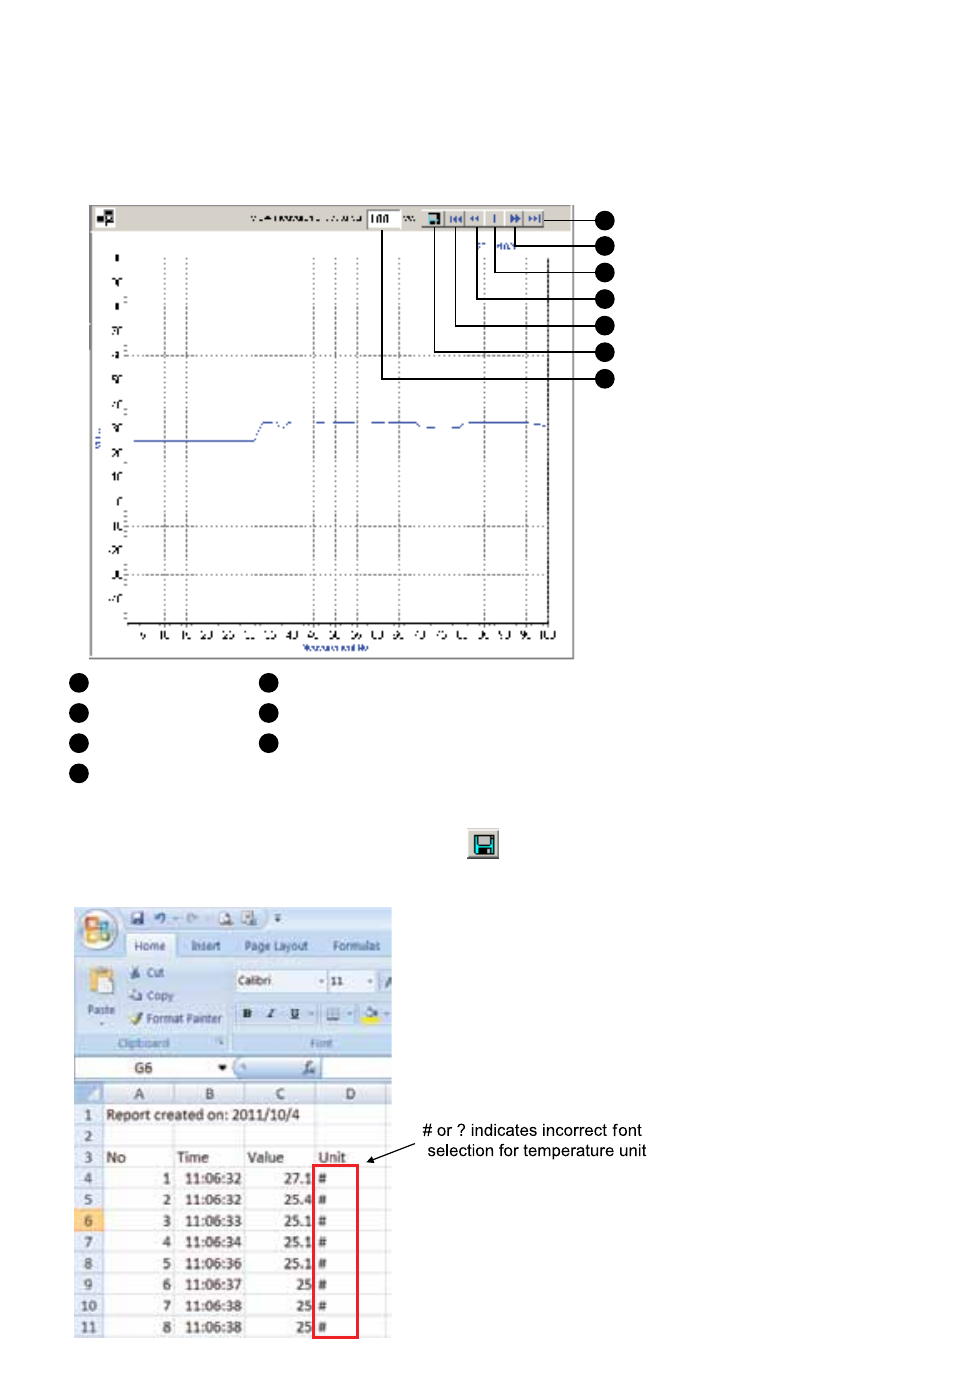
1
Last page
5
First page
2
Next page
6
Save graph in current page as *.bmp
3
Current page
7
Set numbers of measurement data on graph display
4
Previous page
Test Report
Test data can be saved as *.txt, *.xls, *.xml by clicking
button. When opening data report, make sure
selecting font format as Amprobe-A1 or Amprobe-A2 in “Unit” column in order to display correct temperature
unit °C or °F.
1
2
3
4
5
6
7