Graph example – Basler Electric BE1-40Q User Manual
Page 44

Step 3. The results from the above calculations can now be plotted on a graph of the complex power
plane.
Graph Example
Given:
Relay style number is F3E-E1P-B1S1F. (Reference the Style Chart, Figure 1-4.)
Pickup is set to 125. (Reference Table 1-1.)
Test results are obtained as given in Step 1. For this example, we are using the data shown in
columns [1] and [2] of Table 5-4.
Step 1. Calculate P and Q for a current phase angle of 20
°
(Ө = –20°).
(
) (
)
°
−
=
20
cos
806
.
3
3
120
P
= 247.8 W
(
) (
)
°
−
=
20
sin
806
.
3
3
120
Q
= –90.18 vars
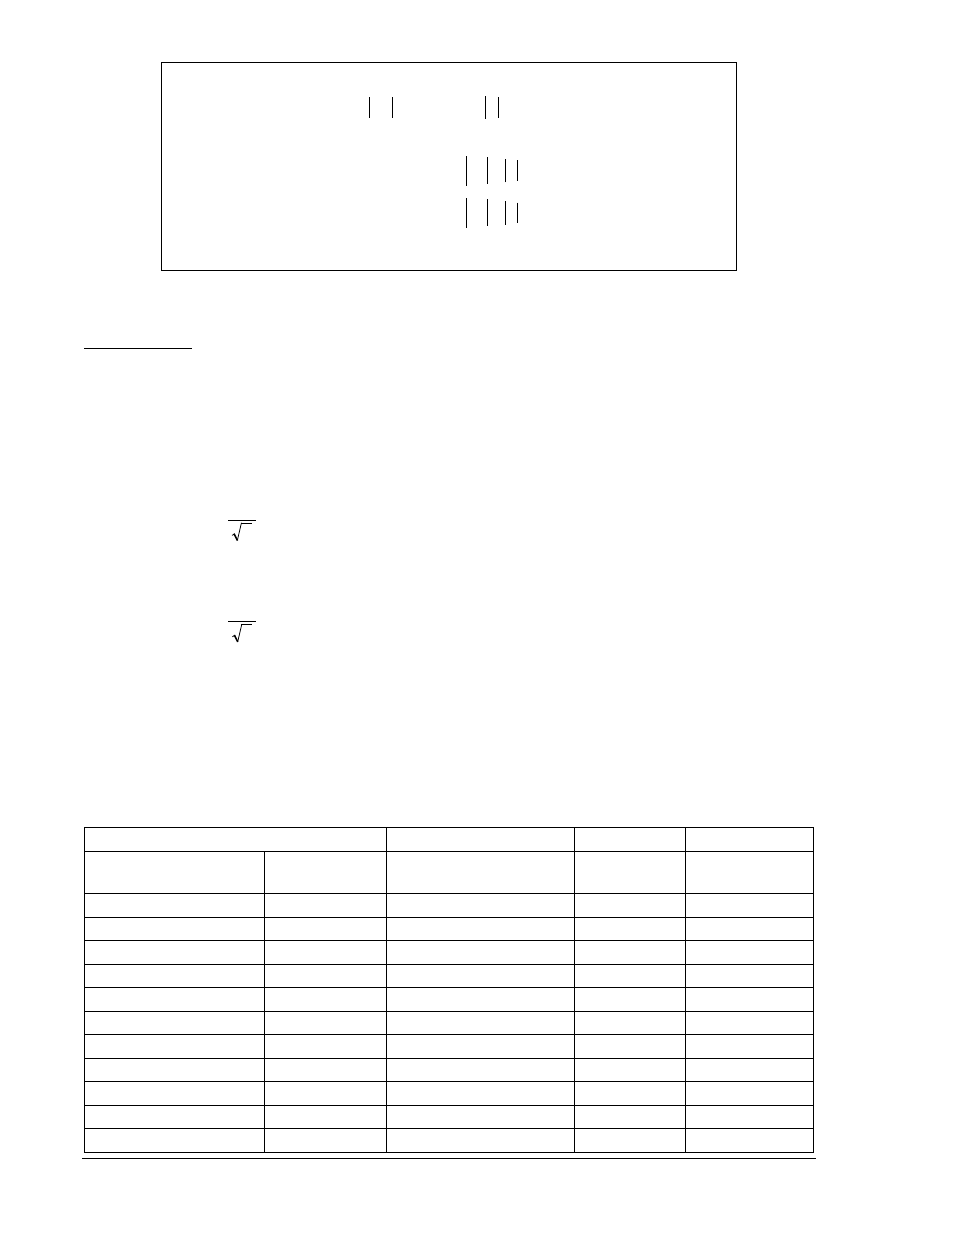
Note that the above results for a phase angle of –20
° have been entered in Table 5-4, columns
[3] and [4], first row. Similarly, the values of P and Q can be solved for the other phase angles of
column [1].
Step 2. Finally, the data from Table 5-4 is shown plotted on the complex power plane shown in Figure
5-3. A blank graph is provided as Figure 5-4.
Table 5-4. Data for the Hypothetical Graph of Figure 5-3
[1]
[2]
[3]
[4]
Current Source
Phase Angle Degrees
System Phase
Angle
Ө
Current Magnitude for
Pickup (Amps)
Real Power
(Watts)
Reactive
Power (Vars)
+20
–20
3.806
247.76
–90.18
+30
–30
2.902
174.12
–100.53
+40
–40
2.404
127.60
–107.07
+50
–50
2.107
93.82
–111.81
+60
–60
1.927
66.75
–115.62
+70
–70
1.827
43.28
–118.92
+80
–80
1.788
21.51
–121.98
+90
–90
1.804
0.00
–125.00
+100
–100
1.879
–22.60
–128.18
+110
–110
2.024
–47.95
–131.74
+120
–120
2.267
–78.54
–136.04
NOTE
If:
β,
I
I
and
V
V
∠
=
∝
∠
=
Then:
Real power (P)
=
(
)
,
β
-
cos
I
V
∝
×
Reactive power (Q)
=
(
)
and
,
β
-
sin
I
V
∝
×
System power factor angle (Ө) =
β
−
∝
5-6
BE1-40Q Setting and Testing
9171500990 Rev N