Typical performance graphs – Linx Technologies TXM-xxx-LR User Manual
Page 5
Advertising
– –
– –
4
5
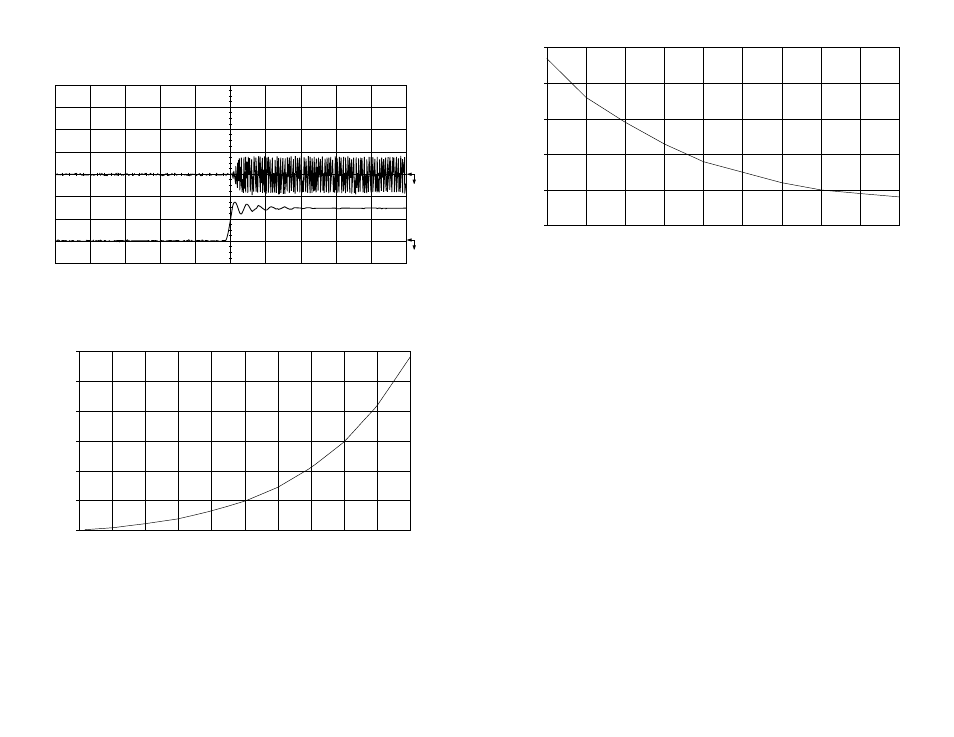
1. 500mV/div
2. 2.00V/div
100nS/div
1
2
12
10
8
6
4
2
0
9.00
6.00
3.00
0.00
-3.00
-6.00
-9.00
-12.00
-15.00
-18.00
-21.00
Output Power (dBm)
LADJ Resistance (k
Ω
)
4.5
4
3.5
3
2.5
2
6.00
3.00
0.00
-3.00
-6.00
-9.00
-12.00
-15.00
-18.00
-21.00
Output Power (dBm)
Current Consumption (mA)
Typical Performance Graphs
Figure 5: Modulation Delay
Figure 6: Output Power vs. LADJ Resistor
Figure 7: Current Consumption vs. Output Power (50% of Duty Cycle)
Advertising
See also other documents in the category Linx Technologies Hardware:
- EVAL-xxx-KH3 (9 pages)
- TXM-xxx-KH3 (19 pages)
- HUM-xxx-DT (37 pages)
- HUM-xxx-RC (31 pages)
- TRM-xxx-TT (29 pages)
- MDEV-xxx-DT (19 pages)
- MDEV-xxx-RC (25 pages)
- TRM-xxx-NT (23 pages)
- RXM-GNSS-GM (27 pages)
- ASY-MDEV-GPS-SR-DB (9 pages)
- EVM-GPS-RM (5 pages)
- MDEV-xxx-TT (23 pages)
- EVM-GNSS-GM (5 pages)
- MDEV-xxx-NT (13 pages)
- MDEV-GPS (9 pages)
- EVM-868-EUR (9 pages)
- TRM-915-R25 (39 pages)
- EVM-915-025 (9 pages)
- TRM-868-EUR (25 pages)
- EVM-868-EUR (16 pages)
- TRM-xxx-DP1203 (15 pages)
- RXM-GPS-R4 (19 pages)
- RXM-GPS-F4 (25 pages)
- EVM-GPS-F4 (7 pages)
- EVM-GPS-R4 (5 pages)
- MDEV-GPS-F4 (16 pages)
- TRM-xxx-LT (19 pages)
- EVAL-xxx-LT (9 pages)
- RXM-xxx-LR (19 pages)
- EVAL-xxx-ES (9 pages)
- TXM-xxx-LC (17 pages)
- TXE-xxx-KH2 (11 pages)
- RXD-xxx-KH2 (11 pages)
- EVAL-xxx-KH2 (5 pages)
- TXM-xxx-ES (17 pages)
- RXM-xxx-ES (17 pages)
- MDEV-xxx-ES (11 pages)
- TXM-900-HP3-xxx (13 pages)
- RXM-900-HP3-xxx (13 pages)
- MDEV-900-HP3-xxx (7 pages)
- RXM-GPS-SG (17 pages)
- ASY-MDEV-GPS-SG-DB (3 pages)
- RXM-GPS-SR (15 pages)
- MDEV-GPS-SR (8 pages)