K how to draw a simple graph (1) – Casio FX-CG10 User Manual
Page 134
5-2
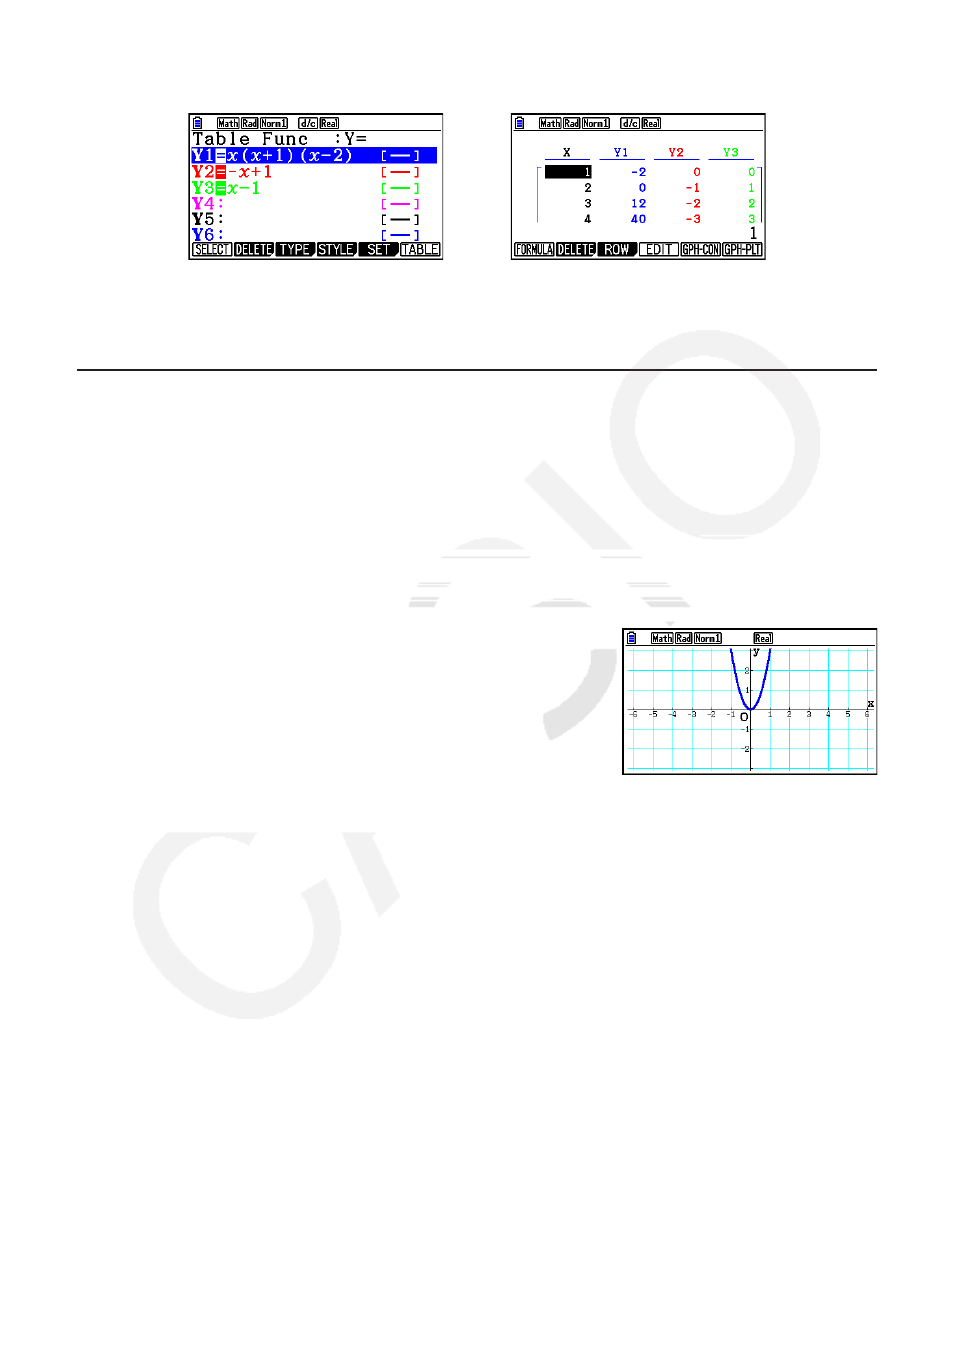
In the case of the Table mode, a number table is created in the same color as the line where
its function is registered.
Table relation list screen
→
Table screen
•
You can change the color used to draw the graph and the number table character color. For
details, see “Changing Graph Properties” (page 5-15).
k How to draw a simple graph (1)
To draw a graph, simply input the applicable function.
1. From the Main Menu, enter the Graph mode.
2. Input the function you want to graph.
Here you would use the V-Window to specify the range and other parameters of the graph.
See page 5-4.
3. Draw the graph.
Example
To graph
y
= 3
x
2
1
m Graph
2 d
vxw
3
6(DRAW) (or w)
• Press
A to return to the screen in step 2 (graph relation list). After drawing a graph, you
can toggle between the graph relation list and graph screen by pressing
!6(G⇔T).