Casio FX-CG10 User Manual
Page 525
15-14
u Deleting the Last Plot Data Line
Perform one of the following operations, depending on the type of cell that is currently
highlighted.
• If the X-value or Y-value of the last line of the plot list screen is selected, press
3(DEL
•
BTM) once to delete the last line of plot data.
• If the X-value or Y-value of any line besides the last line of the plot list screen is selected,
press
3(DEL
•
BTM) once to move the highlighting to the last line and then press
3(DEL
•
BTM) again to delete the last line of plot data.
u To delete all plots
Press
4(DEL-ALL), and a confirmation dialog box will appear. Press 1(Yes) to delete all of
the plots. To cancel the delete operation, press
6(No) instead.
u To return to the Picture Plot screen from the plot list screen
Press
J, !J(QUIT), or !6(G⇔T).
k Displaying Plots on T-Y Coordinates and T-X Coordinates (AXTRANS
Screen)
As can be seen on the plot list screen, the data for each plot includes X and Y-coordinates, as
well as a time value T.
On the Picture Plot screen each plot is normally displayed as coordinates (X, Y) on an X-Y
plane, but time value T can be used to display plots as coordinates (T, Y) on a T-Y plane or as
coordinates (T, X) on a T-X plane.
• Under initial default settings, time values are 0, 1, 2, and so on (arithmetic progression with
a start value of 0 and a step value of 1), in accordance with the sequence that the points are
plotted. You can change the T value assigned to each plot by changing the start value and
step value.
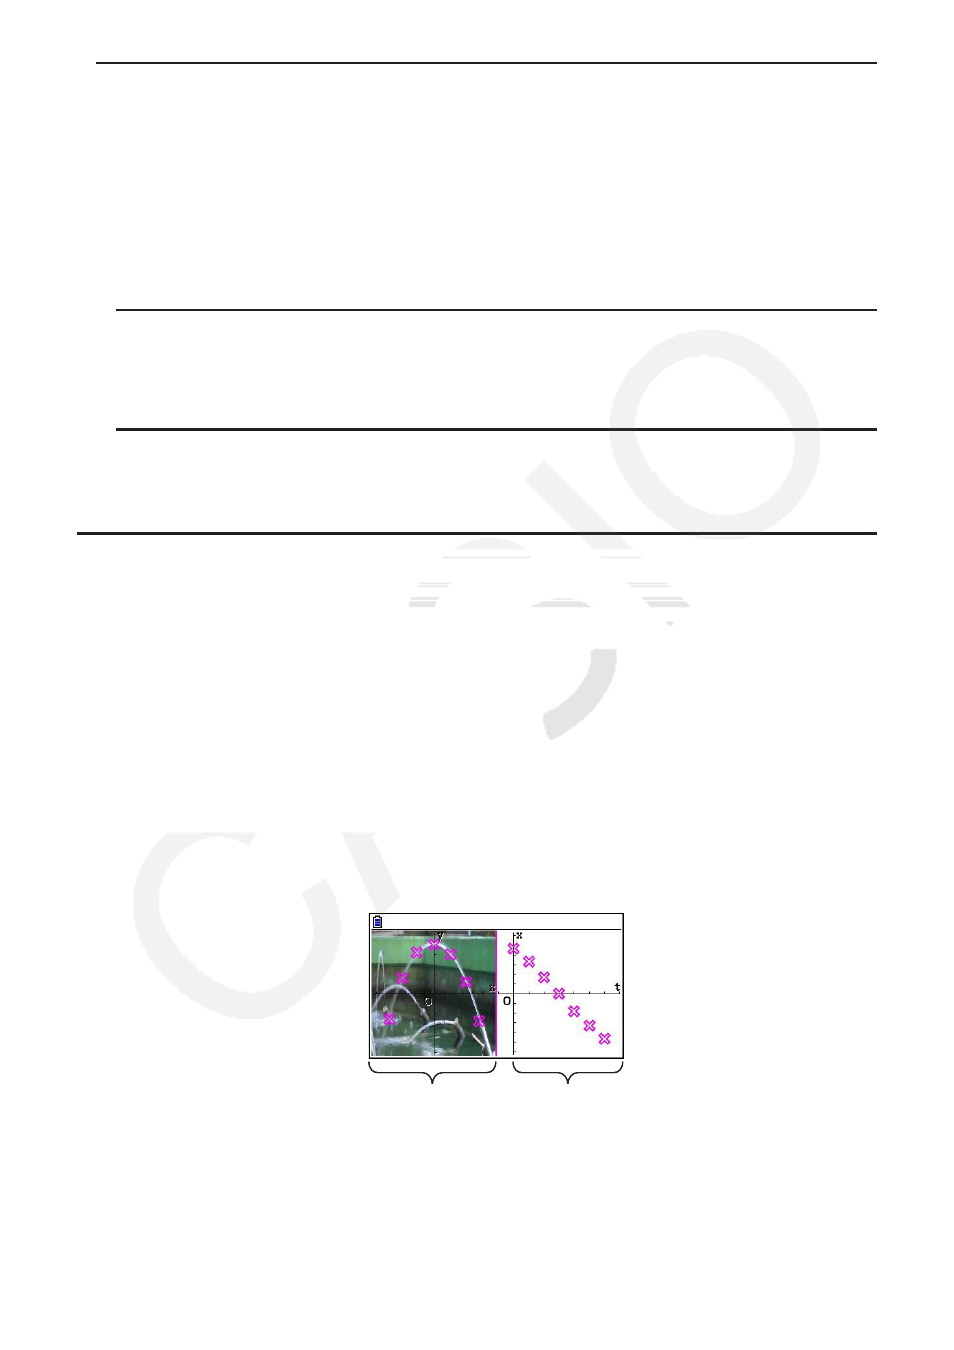
• T-Y coordinate plots and T-X coordinate plots are displayed on a special screen called the
AXTRANS screen. The AXTRANS screen simultaneously displays the X-Y coordinate plots
and the T-Y or T-X coordinate plots as shown in the example below.
X-Y coordinate plots T-X coordinate plots