Manual graphing, Manual, Graphing – Casio FX-CG10 User Manual
Page 157: K rectangular coordinate graph
5-25
6. Manual Graphing
k Rectangular Coordinate Graph
Inputting the Graph command in the Run-Matrix mode enables drawing of rectangular
coordinate graphs.
1. From the Main Menu, enter the Run-Matrix mode.
2. On the Setup screen, change “Input/Output” setting to “Linear”.
3. Configure V-Window settings.
4. Input the commands for drawing the rectangular coordinate graph.
5. Input the function.
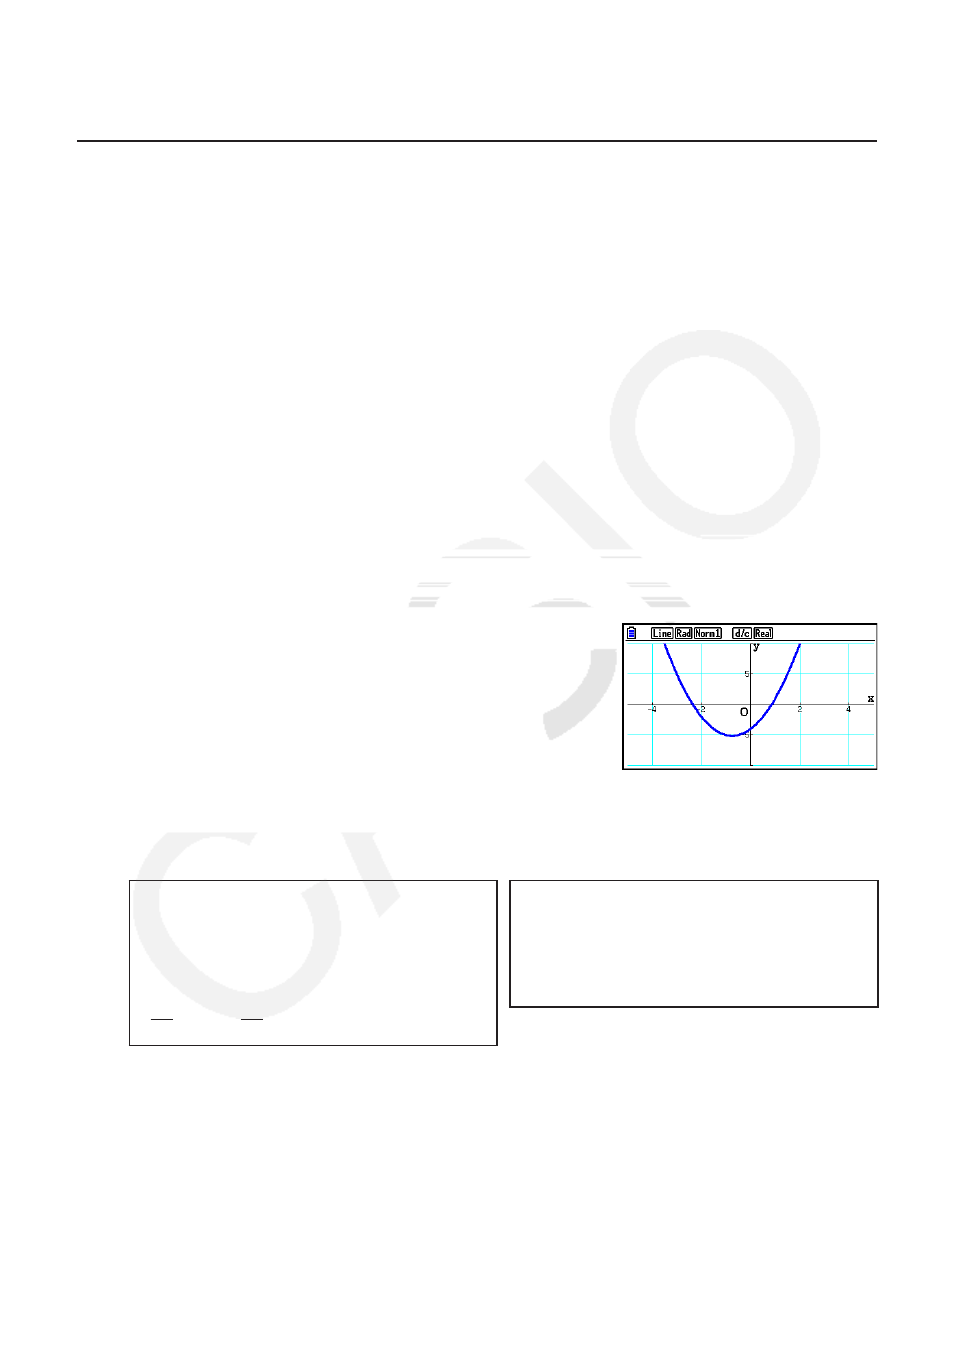
Example
Graph
y
= 2
x
2
+ 3
x
– 4.
Use the following V-Window settings.
Xmin = –5,
Xmax = 5,
Xscale = 2
Ymin = –10,
Ymax = 10,
Yscale = 5
1
m Run-Matrix
2
!m(SET UP)2(Line)J
3
!3(V-WIN) -fwfwcwc
-bawbawfwJ
4
!4(SKETCH)1(Cls)w
5(GRAPH)1(Y=)
5 c
vx+dv-ew
• Certain functions can be graphed easily using built-in function graphs.
• You can draw graphs of the following built-in scientific functions.
Rectangular Coordinate Graph
Polar Coordinate Graph
• sin x •
cos
x
•
tan
x
•
sin
–1
x
• cos
–1
x •
tan
–1
x •
sinh
x
•
cosh
x
• tanh x •
sinh
–1
x •
cosh
–1
x •
tanh
–1
x
•
'
x
•
x
2
•
log
x
•
lnx
• 10
x
•
e
x
•
x
–1
•
3
'
x
•
•
•
• sin
θ •
cos
θ •
tan
θ •
sin
–1
θ
• cos
–1
θ •
tan
–1
θ •
sinh
θ •
cosh
θ
• tanh
θ •
sinh
–1
θ •
cosh
–1
θ •
tanh
–1
θ
•
'
θ •
θ
2
•
log
θ •
ln
θ
• 10
θ
•
e
θ
•
θ
–1
•
3
'
θ
- Input for x and
θ variables is not required for a built-in function.
- When inputting a built-in function, other operators or values cannot be input.
dx
(x)
d
dx
(x)
d
dx
2
(x)
d
2
dx
2
(x)
d
2
∫(x)dx
∫(x)dx