Casella CEL CEL-160 User Manual
Page 17
are more pronounced and it is then important
to realise that the actual signal may not have
followed the course of the straight line
between the points; an obvious example is
when either side of a peak is sampled. It is
also necessary to ensure that the signal does
not contain significant frequencies above the
specified upper limiting frequency as these
take on an `alias' and look like lower ones.
Slight discontinuities will be noticed in
the pre-trigger part of the trace and also at the
trigger point. This manifests itself as 10 µS
gaps at 4 mS intervals and is due to house-
keeping functions of the microprocessor,
these effects are only slight and are limited to
the pre-trigger data only with the main trace
being reproduced in full.
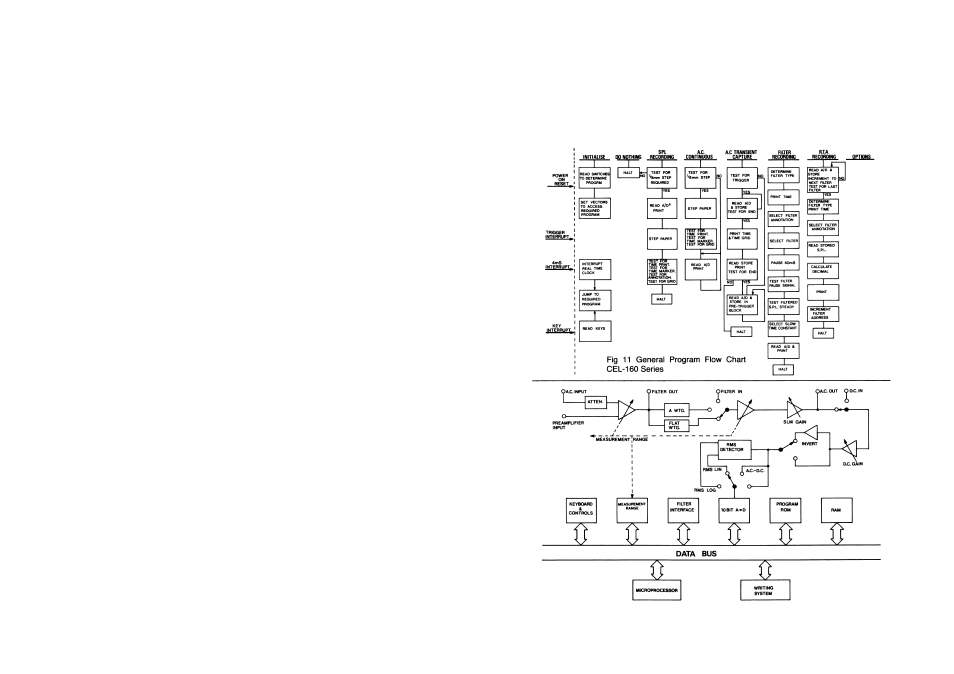
Figure 10: General block diagram for the CEL160 series
CEL-160 Graphic Recorder - Page 17