Graph – Aviosys 8800Pro User Manual
Page 11
Advertising
11
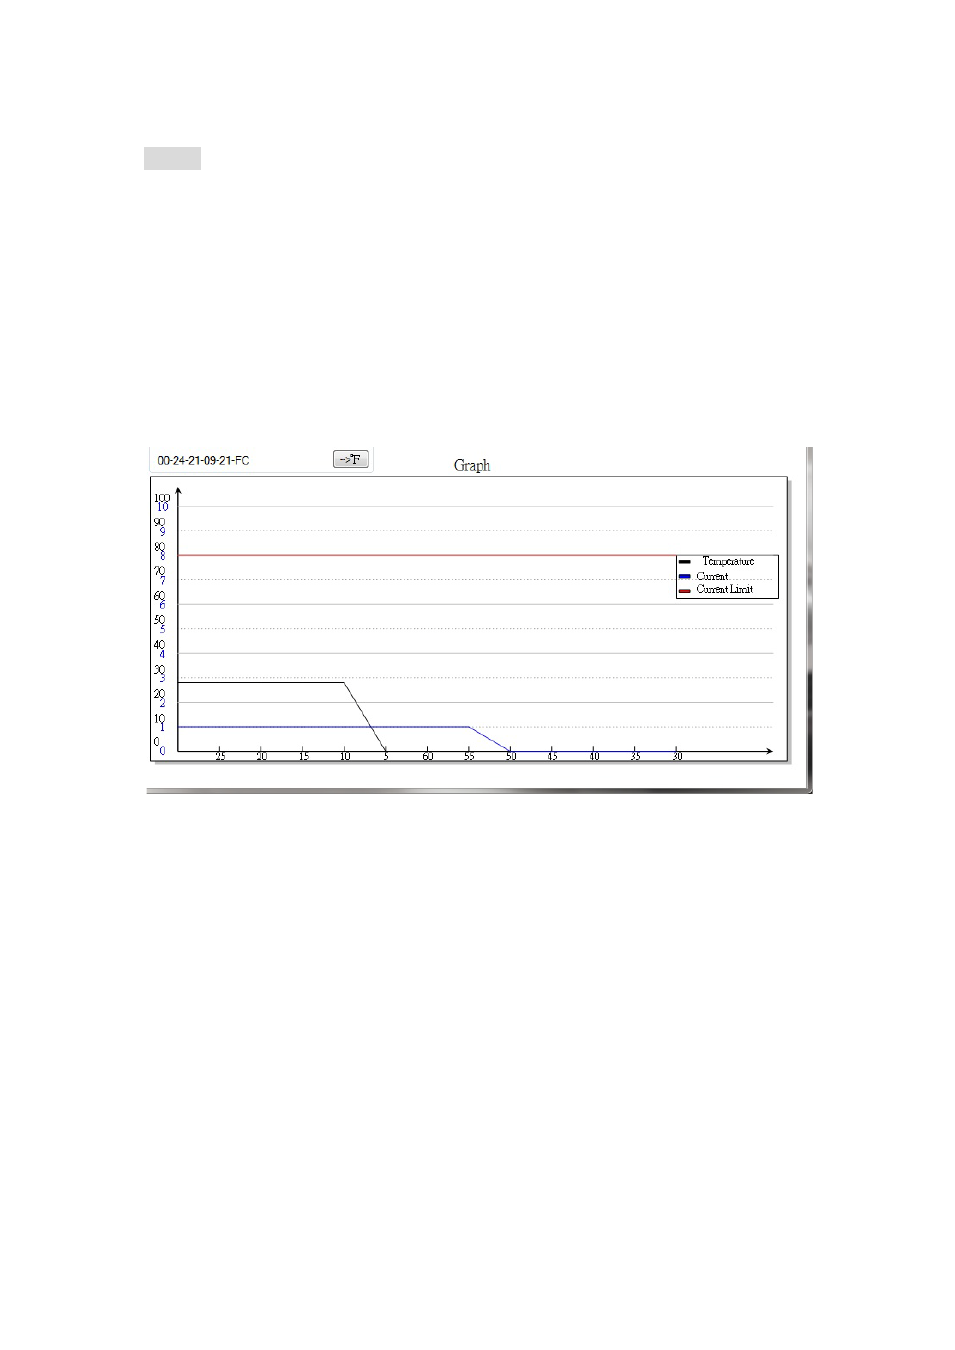
Graph
The Graph show the value of detected temperature, the value of consumed current and the
value of maximum current limit set by customer .
The Black number " 0~100 " at the left side of Graph means Celsius Temperature value
,
The Blue number " 0~10 " at the left side of Graph means the consume value of ampere
The Black number " 5~60 " at the button side of Graph means the seconds.
The latest detect value will update from the left side of Graph .
Black line : Show Temperature value 8800Pro detected.
Blue line : Show current value at ampere 8800Pro detected .
Red line : Show the value of the maximum current customer set .
Advertising
This manual is related to the following products: